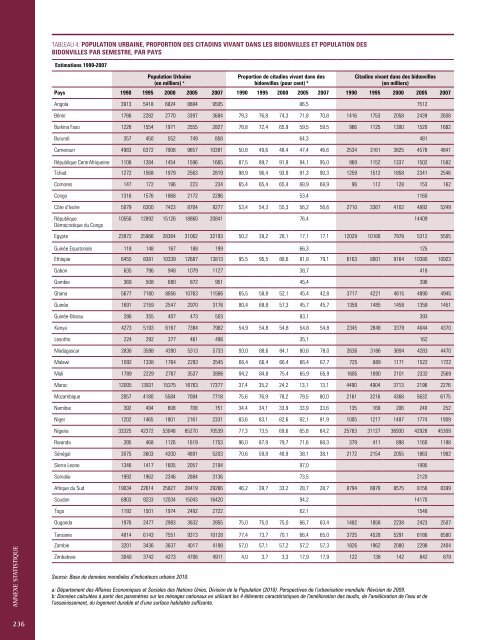
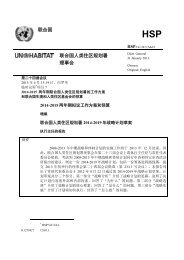
ANNexe sTATIsTIQUe 236 TABLEAU 4: PoPulation urbaine, ProPortion <strong>de</strong>s citadins vivant dans les bidonvilles et PoPulation <strong>de</strong>s bidonvilles Par seMestre, Par Pays estimations 1990-2007 Population urbaine (en milliers) a Proportion <strong>de</strong> citadins vivant dans <strong>de</strong>s bidonvilles (pour cent) b citadins vivant dans <strong>de</strong>s bidonvilles (en milliers) Pays 1990 1995 2000 2005 2007 1990 1995 2000 2005 2007 1990 1995 2000 2005 2007 Angola 3913 5418 6824 8684 9505 86,5 7512 Bénin 1786 2282 2770 3397 3684 79,3 76,8 74,3 71,8 70,8 1416 1753 2058 2439 2608 Burkina Faso 1226 1554 1971 2555 2827 78,8 72,4 65,9 59,5 59,5 966 1125 1300 1520 1682 Burundi 357 450 552 749 858 64,3 481 Cameroun 4983 6372 7908 9657 10381 50,8 49,6 48,4 47,4 46,6 2534 3161 3825 4578 4841 République CentrAfriqueine 1108 1284 1454 1596 1665 87,5 89,7 91,9 94,1 95,0 969 1152 1337 1502 1582 Tchad 1272 1568 1979 2563 2819 98,9 96,4 93,9 91,3 90,3 1259 1512 1858 2341 2546 Comores 147 172 196 223 234 65,4 65,4 65,4 68,9 68,9 96 112 128 153 162 Congo 1316 1576 1868 2172 2296 53,4 1160 Côte d’Ivoire 5079 6200 7423 8704 9277 53,4 54,3 55,3 56,2 56,6 2710 3367 4102 4892 5249 République démocratique du Congo 10556 12892 15126 18860 20841 76,4 14409 Egypte 23972 25966 28364 31062 32193 50,2 39,2 28,1 17,1 17,1 12029 10166 7978 5312 5505 Guinée Equatoriale 118 148 167 188 199 66,3 125 Ethiopie 6455 8381 10339 12687 13813 95,5 95,5 88,6 81,8 79,1 6163 8001 9164 10380 10923 Gabon 635 796 948 1079 1127 38,7 418 Gambie 369 508 680 872 951 45,4 396 Ghana 5677 7180 8856 10763 11566 65,5 58,8 52,1 45,4 42,8 3717 4221 4615 4890 4945 Guinée 1691 2159 2547 2970 3176 80,4 68,8 57,3 45,7 45,7 1359 1485 1458 1358 1451 Guinée-Bissau 286 355 407 473 503 83,1 393 Kenya 4273 5193 6167 7384 7982 54,9 54,8 54,8 54,8 54,8 2345 2848 3379 4044 4370 Lesotho 224 292 377 461 496 35,1 162 Madagascar 2836 3598 4390 5313 5733 93,0 88,6 84,1 80,6 78,0 2636 3186 3694 4283 4470 Malawi 1092 1338 1764 2293 2545 66,4 66,4 66,4 66,4 67,7 725 889 1171 1522 1722 Mali 1789 2229 2787 3537 3896 94,2 84,8 75,4 65,9 65,9 1685 1890 2101 2332 2569 Maroc 12005 13931 15375 16763 17377 37,4 35,2 24,2 13,1 13,1 4490 4904 3713 2196 2276 Mozambique 2857 4180 5584 7084 7718 75,6 76,9 78,2 79,5 80,0 2161 3216 4368 5632 6175 Namibie 392 494 608 708 751 34,4 34,1 33,9 33,9 33,6 135 169 206 240 252 Niger 1202 1465 1801 2161 2331 83,6 83,1 82,6 82,1 81,9 1005 1217 1487 1774 1909 Nigeria 33325 42372 53048 65270 70539 77,3 73,5 69,6 65,8 64,2 25763 31127 36930 42928 45309 Rwanda 395 468 1126 1619 1753 96,0 87,9 79,7 71,6 68,3 379 411 898 1160 1198 Sénégal 3075 3603 4200 4891 5203 70,6 59,8 48,9 38,1 38,1 2172 2154 2055 1863 1982 Sierra Leone 1346 1417 1605 2057 2194 97,0 1995 Somalie 1992 1962 2346 2884 3136 73,5 2120 Afrique du Sud 19034 22614 25827 28419 29266 46,2 39,7 33,2 28,7 28,7 8794 8978 8575 8156 8399 Soudan 6903 9233 12034 15043 16420 94,2 14170 Togo 1192 1501 1974 2492 2722 62,1 1548 Ouganda 1976 2477 2983 3632 3955 75,0 75,0 75,0 66,7 63,4 1482 1858 2238 2423 2507 Tanzanie 4814 6143 7551 9313 10128 77,4 73,7 70,1 66,4 65,0 3725 4528 5291 6186 6580 Zambie 3201 3436 3637 4017 4198 57,0 57,1 57,2 57,2 57,3 1826 1962 2080 2298 2404 Zimbabwe 3040 3742 4273 4706 4911 4,0 3,7 3,3 17,9 17,9 122 138 142 842 879 Source: Base <strong>de</strong> données mondiales d’indicateurs urbains 2010. a: Département <strong>de</strong>s Affaires Economiques et Sociales <strong>de</strong>s Nations Unies, Division <strong>de</strong> la Population (2010). Perspectives <strong>de</strong> l’urbanisation mondiale: Révision <strong>de</strong> 2009. b: Données calculées à partir <strong>de</strong>s paramètres sur les ménages nationaux en utilisant les 4 éléments caractéristiques <strong>de</strong> l’amélioration <strong>de</strong>s taudis, <strong>de</strong> l’amélioration <strong>de</strong> l’eau et <strong>de</strong> l’assainissement, du logement durable et d’une surface habitable suffisante.
TABLEAU 5: ProPortion <strong>de</strong> MénaGes urbains avec accès à une Meilleure source d’eau, un Meilleur assainisseMent, <strong>de</strong>s MatériauX du PrinciPal étaGe bien Finis, une surFace Habitable suFFisante et le raccor<strong>de</strong>Ment auX réseauX téléPHoniQues et électriQues Pays ville année Meilleur accès à l’eau Meilleur accès à l’assainissement accès aux matériaux du principal étage bien finis accès à une surface habitable suffisante accès au téléphone Angola Luanda 2006 51,4 92,4 97,4 75,5 Angola diverses villes et communes 2006 70,6 61,6 68,9 50,6 Bénin Cotonou 1996 99,0 71,2 98,1 77,7 56,6 Bénin Cotonou 2001 100,0 80,9 97,5 12,7 73,7 Bénin djougou 1996 84,3 45,1 71,2 79,7 23,5 Bénin djougou 2001 82,9 29,0 79,3 3,6 40,9 Bénin djougou 2006 90,6 51,9 76,5 75,8 3,9 47,4 Bénin diverses villes et communes 1996 58,4 34,9 66,7 83,4 21,2 Bénin diverses villes et communes 2001 59,5 22,9 62,9 3,8 25,3 Bénin diverses villes et communes 2006 82,5 47,3 79,0 78,6 5,7 55,6 Bénin Porto Novo 1996 57,7 50,8 79,4 78,6 29,4 Bénin Porto Novo 2001 72,5 50,3 86,7 13,6 58,1 Bénin Porto Novo 2006 77,0 68,4 94,3 73,0 8,1 66,9 Burkina Faso diverses villes et communes 1992 53,4 39,6 78,0 78,3 26,1 Burkina Faso diverses villes et communes 1999 73,6 44,6 89,8 82,8 5,4 38,2 Burkina Faso diverses villes et communes 2003 89,1 46,5 90,6 9,6 47,8 Burkina Faso Ouagadougou 1992 74,8 49,5 91,1 82,9 31,5 Burkina Faso Ouagadougou 1999 88,5 51,5 95,0 83,9 13,7 41,3 Burkina Faso Ouagadougou 2003 98,3 67,3 96,5 25,1 56,7 Burundi Bujumbura 2005 81,4 47,1 58,3 66,1 Burundi Gitega 2005 64,1 34,5 61,3 80,4 Burundi Ngozi 2005 87,2 34,8 28,7 75,2 Burundi diverses villes 2005 30,0 10,0 39,5 68,4 accès à l’électricité Cameroun douala 1991 80,5 27,7 93,2 84,2 82,4 Cameroun douala 1998 77,2 80,8 92,7 91,2 7,6 93,8 Cameroun douala 2004 86,9 76,0 88,1 90,4 5,6 95,9 Cameroun douala 2006 99,2 79,9 90,9 89,7 Cameroun diverses villes et communes 1991 72,5 23,6 65,2 84,3 50,3 Cameroun diverses villes et communes 1998 72,0 79,9 74,1 88,2 2,7 70,1 Cameroun diverses villes et communes 2004 82,5 76,5 70,3 86,9 2,3 66,1 Cameroun diverses villes et communes 2006 83,6 71,2 70,5 87,5 Cameroun Yaoundé 1991 86,3 29,4 91,3 82,8 87,4 Cameroun Yaoundé 1998 93,7 81,9 92,4 85,4 11,5 96,3 Cameroun Yaoundé 2004 97,9 79,8 93,2 87,6 5,6 96,2 Cameroun Yaoundé 2006 99,5 79,9 95,6 87,3 République CentrAfriqueine Bangui 1994 74,9 49,5 45,0 83,4 5,8 15,3 République CentrAfriqueine diverses villes et communes 1994 33,4 46,9 12,6 86,2 0,1 2,3 Tchad N’djaména 1997 30,6 69,9 20,9 69,0 2,8 17,2 Tchad N’djaména 2004 87,8 65,4 25,5 71,9 6,5 29,2 Tchad diverses villes et communes 1997 30,5 40,4 9,9 66,1 0,3 3,5 Tchad diverses villes et communes 2004 63,9 39,5 14,1 69,9 0,8 7,8 Comores Moroni 1996 95,7 67,6 72,4 88,1 13,0 55,1 Comores diverses villes et communes 1996 94,2 69,9 63,2 66,5 7,4 50,4 ANNexe sTATIsTIQUe 237
- Page 1 and 2:
L’état des Villes Africaines 201
- Page 3 and 4:
L’état des Villes Africaines 201
- Page 5 and 6:
Préface du PNUe Un urbanisme défa
- Page 7 and 8:
Table des Matières Préface d’ON
- Page 10 and 11:
INTrOdUcTION x Introduction Ce rapp
- Page 12 and 13:
ésUMé 2 Les nouvelles configurati
- Page 14 and 15:
cHAPITre PreMIer Chapitre Premier 0
- Page 16 and 17:
cHAPITre PreMIer 6 1.1 Géographie
- Page 18 and 19:
cHAPITre PreMIer 8 Les problèmes d
- Page 20 and 21:
cHAPITre PreMIer 10 d’une manièr
- Page 22 and 23:
cHAPITre PreMIer 12 Le changement c
- Page 24 and 25:
cHAPITre PreMIer 14 ENCAdRé 1.2: l
- Page 26 and 27:
cHAPITre PreMIer 16 s Addis-Abéba,
- Page 28 and 29:
cHAPITre PreMIer 18 1.3 Gouvernemen
- Page 30 and 31:
cHAPITre PreMIer 20 ce type de gouv
- Page 32 and 33:
cHAPITre PreMIer 22 ENCAdRé 1.3: o
- Page 34 and 35:
cHAPITre PreMIer 24 s Site d'évacu
- Page 36 and 37:
cHAPITre PreMIer 26 ENCAdRé 1.6: v
- Page 38 and 39:
cHAPITre PreMIer 28 les conséquenc
- Page 40 and 41:
cHAPITre PreMIer 30 s Kibera, à Na
- Page 42 and 43:
cHAPITre PreMIer 32 1.5 Les Finance
- Page 44 and 45:
cHAPITre PreMIer 34 GRAPHIQUE 1.5:
- Page 46 and 47:
cHAPITre PreMIer 36 ENCAdRé 1.8: F
- Page 48 and 49:
cHAPITre PreMIer 38 domaines, déto
- Page 50 and 51:
cHAPITre PreMIer 40 1.7 Les Plus Gr
- Page 52 and 53:
cHAPITre PreMIer 42 TABLEAU 1.7: le
- Page 54 and 55:
cHAPITre PreMIer 44 ENCAdRé 1.9: P
- Page 56 and 57:
Chapitre Deux 02 cHAPITre deUx 46 s
- Page 58 and 59:
cHAPITre deUx 48 2.1 L’expansion
- Page 60 and 61:
cHAPITre deUx 50 CARTE 2.2: PoPulat
- Page 62 and 63:
cHAPITre deUx 52 TABLEAU 2.5: indic
- Page 64 and 65:
cHAPITre deUx 54 Les Liens Entre Pa
- Page 66 and 67:
cHAPITre deUx 56 inversée, le coef
- Page 68 and 69:
cHAPITre deUx 58 TABLEAU 2.8: cHôM
- Page 70 and 71:
cHAPITre deUx 60 ENCAdRé 2.1: le P
- Page 72 and 73:
cHAPITre deUx 62 d’accès aux ser
- Page 74 and 75:
cHAPITre deUx 64 s Casablanca, Maro
- Page 76 and 77:
cHAPITre deUx 66 de Tunis, Fès, Me
- Page 78 and 79:
cHAPITre deUx 68 s Le Caire, Egypte
- Page 80 and 81:
cHAPITre deUx 70 s Hammamet, Tunisi
- Page 82 and 83:
cHAPITre deUx 72 TABLEAU 2.9: Eau d
- Page 84 and 85:
cHAPITre deUx 74 très vulnérable
- Page 86 and 87:
cHAPITre deUx 76 CARTE 2.3: trajECt
- Page 88 and 89:
cHAPITre deUx 78 • La culture. L
- Page 90 and 91:
cHAPITre deUx 80 CARTE 2.4: la stra
- Page 92 and 93:
cHAPITre deUx 82 entité administra
- Page 94 and 95:
Chapitre trois 03 cHAPITre TrOIs 84
- Page 96 and 97:
cHAPITre TrOIs 86 3.1 La Géographi
- Page 98 and 99:
cHAPITre TrOIs 88 TABLEAU 3.2: aFri
- Page 100 and 101:
cHAPITre TrOIs 90 des richesses, de
- Page 102 and 103:
cHAPITre TrOIs 92 CARTE 3.4: distri
- Page 104 and 105:
cHAPITre TrOIs 94 s dakar, Sénéga
- Page 106 and 107:
cHAPITre TrOIs 96 Les Liens Entre P
- Page 108 and 109:
cHAPITre TrOIs 98 3.2 La Géographi
- Page 110 and 111:
cHAPITre TrOIs 100 La proportion de
- Page 112 and 113:
cHAPITre TrOIs 102 s Accra, Ghana.
- Page 114 and 115:
cHAPITre TrOIs 104 FIGURE 3.2: cat
- Page 116 and 117:
cHAPITre TrOIs 106 supplémentaire.
- Page 118 and 119:
cHAPITre TrOIs 108 nopole de l’Et
- Page 120 and 121:
cHAPITre TrOIs 110 à aménager, y
- Page 122 and 123:
cHAPITre TrOIs 112 s Bidonvilles de
- Page 124 and 125:
cHAPITre TrOIs 114 3.4 La Géograph
- Page 126 and 127:
cHAPITre TrOIs 116 Le changement cl
- Page 128 and 129:
cHAPITre TrOIs 118 s dakar, Sénég
- Page 130 and 131:
cHAPITre TrOIs 120 CARTE 3.10: dist
- Page 132 and 133:
cHAPITre QUATre cHAPITre QUATre Cha
- Page 134 and 135:
cHAPITre QUATre 124 4.1 Géographie
- Page 136 and 137:
cHAPITre QUATre 126 TABLEAU 4.2: aF
- Page 138 and 139:
cHAPITre QUATre 128 ENCAdRé 4.1: l
- Page 140 and 141:
cHAPITre QUATre 130 4.2 La Géograp
- Page 142 and 143:
cHAPITre QUATre 132 Faire Face à L
- Page 144 and 145:
cHAPITre QUATre 134 ENCAdRé 4.4: M
- Page 146 and 147:
cHAPITre QUATre 136 de ces marchés
- Page 148 and 149:
cHAPITre QUATre 138 du Rwanda. Les
- Page 150 and 151:
cHAPITre QUATre 140 s Elèves dans
- Page 152 and 153:
cHAPITre QUATre 142 plus, en l’ab
- Page 154 and 155:
cHAPITre QUATre 144 s Kampala, Ouga
- Page 156 and 157:
cHAPITre QUATre 146 du marché fonc
- Page 158 and 159:
cHAPITre QUATre 148 4.4 La Géograp
- Page 160 and 161:
cHAPITre QUATre 150 s Logements à
- Page 162 and 163:
cHAPITre QUATre 152 ENCAdRé 4.8: u
- Page 164 and 165:
cHAPITre QUATre 154 4.5 Les Nouveau
- Page 166 and 167:
cHAPITre QUATre 156 carte 4.7: la r
- Page 168 and 169:
cHAPITre cINQ Chapitre Cinq 05 158
- Page 170 and 171:
cHAPITre cINQ 160 5.1N Géographie
- Page 172 and 173:
cHAPITre cINQ 162 TABLEAU 5.2: evol
- Page 174 and 175:
cHAPITre cINQ 164 TABLEAU 5.5: donn
- Page 176 and 177:
cHAPITre cINQ 166 s Un nouveau quar
- Page 178 and 179:
cHAPITre cINQ 168 5.2 Géographie
- Page 180 and 181:
cHAPITre cINQ 170 TABLEAU 5.9: tauX
- Page 182 and 183:
cHAPITre cINQ 172 5.3 Géographie U
- Page 184 and 185:
cHAPITre cINQ 174 des droits coutum
- Page 186 and 187:
cHAPITre cINQ 176 terrains et de la
- Page 188 and 189:
cHAPITre cINQ 178 s Construction d
- Page 190 and 191:
cHAPITre cINQ 180 Economie Politiqu
- Page 192 and 193:
cHAPITre cINQ 182 et qui échappent
- Page 194 and 195:
cHAPITre cINQ 184 5.5 Questions ém
- Page 196 and 197: cHAPITre cINQ 186 s Luanda, Angola.
- Page 198 and 199: cHAPITre cINQ 188 report. De nouvel
- Page 200 and 201: cHAPITre sIx Chapitre Six 06 190 s
- Page 202 and 203: cHAPITre sIx 192 6.1 La Géographie
- Page 204 and 205: cHAPITre sIx 194 On se penche ici s
- Page 206 and 207: cHAPITre sIx 196 s Lusaka, Zambie.
- Page 208 and 209: cHAPITre sIx 198 s Enfants des rues
- Page 210 and 211: cHAPITre sIx 200 épuisé, le racco
- Page 212 and 213: cHAPITre sIx 202 6.2 La Géographie
- Page 214 and 215: cHAPITre sIx 204 s Quartier informe
- Page 216 and 217: cHAPITre sIx 206 6.3 La Géographie
- Page 218 and 219: cHAPITre sIx 208 GRAPHIQUE 6.8: dé
- Page 220 and 221: cHAPITre sIx 210 GRAPHIQUE 6.9: les
- Page 222 and 223: cHAPITre sIx 212 Comment Fonctionne
- Page 224 and 225: cHAPITre sIx 214 Slag Piles Diepklo
- Page 226 and 227: cHAPITre sIx 216 mauvaise sécurit
- Page 228 and 229: cHAPITre sIx 218 ENCAdRé 6.5: un r
- Page 230 and 231: cHAPITre sIx 220 6.5 Nouveaux Probl
- Page 232 and 233: cHAPITre sIx 222 s Le Stade Moses M
- Page 234 and 235: cHAPITre sIx 224 Après l’avènem
- Page 236 and 237: ANNexe sTATIsTIQUe 226 Annexe stati
- Page 238 and 239: ANNexe sTATIsTIQUe 228 Population t
- Page 240 and 241: ANNexe sTATIsTIQUe 230 TABLEAU 2: P
- Page 242 and 243: ANNexe sTATIsTIQUe 232 TABLEAU 3: P
- Page 244 and 245: ANNexe sTATIsTIQUe 234 Population d
- Page 248 and 249: ANNexe sTATIsTIQUe 238 Pays ville a
- Page 250 and 251: ANNexe sTATIsTIQUe 240 Pays ville a
- Page 252 and 253: ANNexe sTATIsTIQUe 242 Pays ville a
- Page 254 and 255: ANNexe sTATIsTIQUe 244 Pays ville a
- Page 256 and 257: ANNexe sTATIsTIQUe 246 Pays année
- Page 258 and 259: ANNexe sTATIsTIQUe 248 TABLEAU 7: c
- Page 260 and 261: ANNexe sTATIsTIQUe 250 année zone
- Page 262 and 263: ANNexe sTATIsTIQUe 252 TABLEAU 11:
- Page 264 and 265: ANNexe sTATIsTIQUe 254 TABLEAU 12:
- Page 266: ANNexe sTATIsTIQUe 256 TABLEAU 13: