le même processus pour tous - Université de Bourgogne
le même processus pour tous - Université de Bourgogne
le même processus pour tous - Université de Bourgogne

You also want an ePaper? Increase the reach of your titles
YUMPU automatically turns print PDFs into web optimized ePapers that Google loves.
s.chol<strong>le</strong>t@isa-lil<strong>le</strong>.fr<br />
32<br />
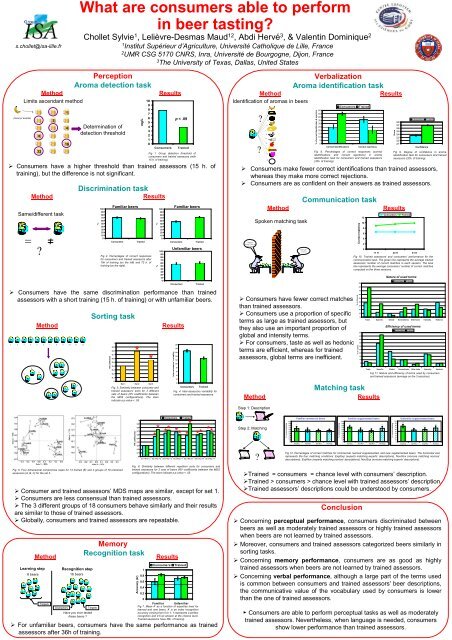
What are consumers ab<strong>le</strong> to perform<br />
in beer tasting?<br />
Chol<strong>le</strong>t Sylvie 1 , Lelièvre-Desmas Maud 12 , Abdi Hervé 3 , & Va<strong>le</strong>ntin Dominique 2<br />
1 Institut Supérieur d’Agriculture, <strong>Université</strong> Catholique <strong>de</strong> Lil<strong>le</strong>, France<br />
2 UMR CSG 5170 CNRS, Inra, <strong>Université</strong> <strong>de</strong> <strong>Bourgogne</strong>, Dijon, France<br />
3 The University of Texas, Dallas, United States<br />
Perception<br />
Aroma <strong>de</strong>tection task<br />
Method Results<br />
Limits ascendant method<br />
10<br />
9<br />
8<br />
1<br />
7<br />
(Isoamyl acetate)<br />
8<br />
2<br />
4 Determination of<br />
<strong>de</strong>tection threshold<br />
6<br />
5<br />
4<br />
3<br />
2<br />
1<br />
p < .09<br />
16<br />
0<br />
Consumers Trained<br />
Consumers have a higher threshold than trained assessors (15 h. of<br />
training), but the difference is not significant.<br />
1<br />
Discrimination task<br />
Method Results<br />
Same/different task<br />
= ? ≠<br />
6<br />
Sorting task<br />
Method Results<br />
1 1<br />
5<br />
Method<br />
Memory<br />
Recognition task<br />
Results<br />
Learning step Recognition step<br />
8 beers<br />
16 beers<br />
Targets<br />
9<br />
3<br />
2<br />
7<br />
1 2<br />
8<br />
Fig. 5: Four dimensional compromise maps for 13 trained (E) and 3 groups of 18 untrained<br />
assessors (A, B, C) for the set 3.<br />
Distractors<br />
4<br />
1 0<br />
Have you ever tasted<br />
these beers ?<br />
Targets<br />
RV coefficients<br />
1<br />
0,9<br />
0,8<br />
0,7<br />
0,6<br />
0,5<br />
0,4<br />
0,3<br />
0,2<br />
0,1<br />
0<br />
Accuracy (A')<br />
mg/L<br />
Set 1 Set 2 Set 3<br />
1<br />
0,8<br />
0,6<br />
0,4<br />
0,2<br />
Consumers Trained<br />
0<br />
Familiar Unfamiliar<br />
Fig 7. Mean A’ as a function of expertise <strong>le</strong>vel for<br />
<strong>le</strong>arned and new beers. A’ is an in<strong>de</strong>x recognition<br />
accuracy varying from 0 to 1; 1 represents a perfect<br />
recognition and 0.5 an answer at the chance <strong>le</strong>vel.<br />
Trained assessors have 36h. of training.<br />
For unfamiliar beers, consumers have the same performance as trained<br />
assessors after 36h of training.<br />
RV coefficients<br />
*<br />
1<br />
0,9<br />
0,8<br />
0,7<br />
0,6<br />
0,5<br />
0,4<br />
0,3<br />
0,2<br />
0,1<br />
*<br />
Fig. 3: Similarity between consumer and<br />
trained assessors’ sorts for 3 different<br />
sets of beers (RV coefficients between<br />
the MDS configurations). The stars<br />
indicate a p-value < .05.<br />
Fig 1. Group <strong>de</strong>tection threshold of<br />
consumers and trained assessors (with<br />
15 h. of training).<br />
Consumers Trained<br />
* * *<br />
* * * * *<br />
* *<br />
* *<br />
0<br />
Set 1 Rep 1-2 Set 3 Rep 1-2 Set 3 Rep 1-3 Set 3 Rep 1-4 Set 3 Rep 2-3 Set 3 Rep 2-4 Set 3 Rep 3-4<br />
Fig. 6: Similarity between different repetition sorts for consumers and<br />
trained assessors for 2 sets of beers (RV coefficients between the MDS<br />
configurations). The stars indicate a p-value < .05.<br />
Consumer and trained assessors’ MDS maps are similar, except for set 1.<br />
Consumers are <strong>le</strong>ss consensual than trained assessors.<br />
The 3 different groups of 18 consumers behave similarly and their results<br />
are similar to those of trained assessors.<br />
Globally, consumers and trained assessors are repeatab<strong>le</strong>.<br />
%<br />
%<br />
100<br />
90<br />
80<br />
70<br />
60<br />
50<br />
40<br />
30<br />
20<br />
10<br />
0<br />
100<br />
90<br />
80<br />
70<br />
60<br />
50<br />
40<br />
30<br />
20<br />
10<br />
0<br />
Inter-assessors' variability<br />
Familiar beers<br />
Consumers Trained<br />
Unfamiliar beers<br />
Consumers Trained<br />
Consumers have the same discrimination performance than trained<br />
assessors with a short training (15 h. of training) or with unfamiliar beers.<br />
1 2 3 4 5 6 7 8 9 10 11 12<br />
%<br />
100<br />
90<br />
80<br />
70<br />
60<br />
50<br />
40<br />
30<br />
20<br />
10<br />
0<br />
Familiar beers<br />
Consumers Trained<br />
Fig 2. Percentages of correct responses<br />
for consumers and trained assessors after<br />
15h of training (on the <strong>le</strong>ft) and 72 h. of<br />
training (on the right).<br />
20<br />
18<br />
16<br />
14<br />
12<br />
10<br />
8<br />
6<br />
4<br />
2<br />
0<br />
Consumers Trained<br />
Fig. 4: Inter-assessors variability for<br />
consumers and trained assessors.<br />
Verbalization<br />
Aroma i<strong>de</strong>ntification task<br />
Method<br />
Results<br />
I<strong>de</strong>ntification of aromas in beers<br />
?<br />
?<br />
% of correct i<strong>de</strong>ntification & rejection<br />
50<br />
45<br />
40<br />
35<br />
30<br />
25<br />
20<br />
15<br />
10<br />
5<br />
0<br />
Consumers Trained<br />
Correct i<strong>de</strong>ntifications Correct rejections<br />
Consumers make fewer correct i<strong>de</strong>ntifications than trained assessors,<br />
whereas they make more correct rejections.<br />
Consumers are as confi<strong>de</strong>nt on their answers as trained assessors.<br />
Banana !<br />
Oh yes ! This one<br />
smells banana!<br />
Communication task<br />
Method Results<br />
Banana ? OK !<br />
I have got it !<br />
It’s this one !<br />
Consumers have fewer correct matches<br />
than trained assessors.<br />
Consumers use a proportion of specific<br />
terms as large as trained assessors, but<br />
they also use an important proportion of<br />
global and intensity terms.<br />
For consumers, taste as well as hedonic<br />
terms are efficient, whereas for trained<br />
assessors, global terms are inefficient.<br />
Method<br />
Step 1: Description<br />
O<strong>de</strong>ur: Très forte <strong>de</strong> f<strong>le</strong>u r<br />
Lilas<br />
Plutôt dé sagréab<strong>le</strong><br />
Goût : Goût trè s lilas<br />
Confère un goût amer<br />
Plutôt dé sagréab<strong>le</strong><br />
Très pe rsi stant en bouche<br />
Step 2: Matching<br />
O<strong>de</strong>ur: Agrume<br />
O<strong>de</strong>ur (<strong>de</strong> citr on) ou plu tôt Citro nnel<strong>le</strong><br />
Très forte, F<strong>le</strong>ur d’oranger<br />
Goût : Goût agrume<br />
R appel<strong>le</strong> la f<strong>le</strong>ur d’oranger<br />
Fait plutôt a rtificiel<br />
Goût as sez persi stant<br />
Spoken matching task<br />
?<br />
O<strong>de</strong>ur: Très forte <strong>de</strong> f<strong>le</strong>u r<br />
Lilas<br />
Plutôt dé sagréab<strong>le</strong><br />
Goût : Goût trè s lilas<br />
Confère un goût amer<br />
Plutôt dé sagréab<strong>le</strong><br />
Très pe rsi stant en bouche<br />
100<br />
90<br />
80<br />
70<br />
60<br />
50<br />
40<br />
30<br />
20<br />
10<br />
0<br />
% correct matching<br />
Familiar commercial beers<br />
**<br />
*<br />
Fig 8. Percentages of correct responses (correct<br />
i<strong>de</strong>ntifications and correct rejections) in aroma<br />
i<strong>de</strong>ntification task for consumers and trained assessors<br />
(32h. of training).<br />
Correct matches<br />
Matching task<br />
Results<br />
Exp/Exp Nov/Nov Exp/Nov Nov/Exp<br />
Conclusion<br />
12<br />
10<br />
8<br />
6<br />
4<br />
2<br />
Consumers Trained<br />
0<br />
11 H 44 H 61 H<br />
Fig 10. Trained assessors’ and consumers’ performance for the<br />
communication task. The green line represents the average trained<br />
assessors’ number of correct matches in each session. The blue<br />
line represents the average consumers’ number of correct matches<br />
computed on the three sessions.<br />
Familiar supp<strong>le</strong>mented beers<br />
Concerning perceptual performance, consumers discriminated between<br />
beers as well as mo<strong>de</strong>rately trained assessors or highly trained assessors<br />
when beers are not <strong>le</strong>arned by trained assessors.<br />
Moreover, consumers and trained assessors categorized beers similarly in<br />
sorting tasks.<br />
Concerning memory performance, consumers are as good as highly<br />
trained assessors when beers are not <strong>le</strong>arned by trained assessors.<br />
Concerning verbal performance, although a large part of the terms used<br />
is common between consumers and trained assessors' beer <strong>de</strong>scriptions,<br />
the communicative value of the vocabulary used by consumers is lower<br />
than the one of trained assessors.<br />
100<br />
90<br />
80<br />
70<br />
60<br />
50<br />
40<br />
30<br />
20<br />
10<br />
0<br />
% correct matching<br />
*** **<br />
Exp/Exp Nov/Nov Exp/Nov Nov/Exp<br />
Efficiency of used terms<br />
Unfamiliar supp<strong>le</strong>mented beers<br />
► Consumers are ab<strong>le</strong> to perform perceptual tasks as well as mo<strong>de</strong>rately<br />
trained assessors. Neverthe<strong>le</strong>ss, when language is nee<strong>de</strong>d, consumers<br />
show lower performance than trained assessors.<br />
100<br />
90<br />
80<br />
70<br />
60<br />
50<br />
40<br />
30<br />
20<br />
10<br />
0<br />
% correct matching<br />
***<br />
Exp/Exp Nov/Nov Exp/Nov Nov/Exp<br />
Fig 12. Percentages of correct matches for commercial, <strong>le</strong>arned supp<strong>le</strong>mented, and new supp<strong>le</strong>mented beers. The horizontal axis<br />
represents the four matching conditions: Exp/Exp (experts matching experts’ <strong>de</strong>scriptions), Nov/Nov (novices matching novices’<br />
<strong>de</strong>scriptions), Exp/Nov (experts matching novices’ <strong>de</strong>scriptions), Nov/Exp (novices matching experts’ <strong>de</strong>scriptions).<br />
Trained = consumers = chance <strong>le</strong>vel with consumers’ <strong>de</strong>scription.<br />
Trained > consumers > chance <strong>le</strong>vel with trained assessors’ <strong>de</strong>scription.<br />
Trained assessors’ <strong>de</strong>scriptions could be un<strong>de</strong>rstood by consumers.<br />
% of efficacity<br />
% of citation<br />
90<br />
80<br />
70<br />
60<br />
50<br />
40<br />
30<br />
20<br />
10<br />
0<br />
50<br />
45<br />
40<br />
35<br />
30<br />
25<br />
20<br />
15<br />
10<br />
5<br />
0<br />
2,8<br />
2,7<br />
2,6<br />
2,5<br />
2,4<br />
2,3<br />
2,2<br />
2,1<br />
Score<br />
Nature of used terms<br />
Consumers Trained<br />
Taste Specific Global Somesthesic After-taste Intensity Hedonic<br />
Consumers Trained<br />
Consumers Trained<br />
Confi<strong>de</strong>nce<br />
Fig 9. Degree of confi<strong>de</strong>nce in aroma<br />
i<strong>de</strong>ntification task for consumers and trained<br />
assessors (32h. of training).<br />
Taste Specific Global Somesthesic After-taste Intensity Hedonic<br />
Fig 11. Nature and efficiency of terms used by consumers<br />
and trained assessors (average on the 3 sessions).<br />
**<br />
***