Livro_do PAt arquivo íntegra para site (1)

You also want an ePaper? Increase the reach of your titles
YUMPU automatically turns print PDFs into web optimized ePapers that Google loves.
48<br />
40 anos <strong>do</strong> PAT – Programa de Alimentação <strong>do</strong> Trabalha<strong>do</strong>r<br />
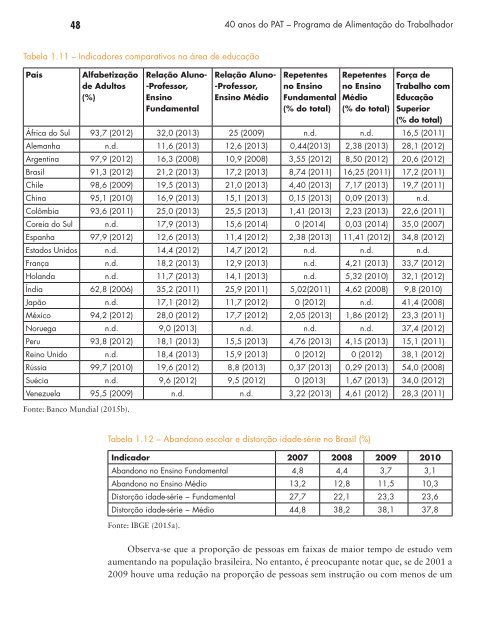
Tabela 1.11 – Indica<strong>do</strong>res com<strong>para</strong>tivos na área de educação<br />
País<br />
Alfabetização<br />
de Adultos<br />
(%)<br />
Relação Aluno-<br />
-Professor,<br />
Ensino<br />
Fundamental<br />
Relação Aluno-<br />
-Professor,<br />
Ensino Médio<br />
Repetentes<br />
no Ensino<br />
Fundamental<br />
(% <strong>do</strong> total)<br />
Repetentes<br />
no Ensino<br />
Médio<br />
(% <strong>do</strong> total)<br />
Força de<br />
Trabalho com<br />
Educação<br />
Superior<br />
(% <strong>do</strong> total)<br />
África <strong>do</strong> Sul 93,7 (2012) 32,0 (2013) 25 (2009) n.d. n.d. 16,5 (2011)<br />
Alemanha n.d. 11,6 (2013) 12,6 (2013) 0,44(2013) 2,38 (2013) 28,1 (2012)<br />
Argentina 97,9 (2012) 16,3 (2008) 10,9 (2008) 3,55 (2012) 8,50 (2012) 20,6 (2012)<br />
Brasil 91,3 (2012) 21,2 (2013) 17,2 (2013) 8,74 (2011) 16,25 (2011) 17,2 (2011)<br />
Chile 98,6 (2009) 19,5 (2013) 21,0 (2013) 4,40 (2013) 7,17 (2013) 19,7 (2011)<br />
China 95,1 (2010) 16,9 (2013) 15,1 (2013) 0,15 (2013) 0,09 (2013) n.d.<br />
Colômbia 93,6 (2011) 25,0 (2013) 25,5 (2013) 1,41 (2013) 2,23 (2013) 22,6 (2011)<br />
Coreia <strong>do</strong> Sul n.d. 17,9 (2013) 15,6 (2014) 0 (2014) 0,03 (2014) 35,0 (2007)<br />
Espanha 97,9 (2012) 12,6 (2013) 11,4 (2012) 2,38 (2013) 11,41 (2012) 34,8 (2012)<br />
Esta<strong>do</strong>s Uni<strong>do</strong>s n.d. 14,4 (2012) 14,7 (2012) n.d. n.d. n.d.<br />
França n.d. 18,2 (2013) 12,9 (2013) n.d. 4,21 (2013) 33,7 (2012)<br />
Holanda n.d. 11,7 (2013) 14,1 (2013) n.d. 5,32 (2010) 32,1 (2012)<br />
Índia 62,8 (2006) 35,2 (2011) 25,9 (2011) 5,02(2011) 4,62 (2008) 9,8 (2010)<br />
Japão n.d. 17,1 (2012) 11,7 (2012) 0 (2012) n.d. 41,4 (2008)<br />
México 94,2 (2012) 28,0 (2012) 17,7 (2012) 2,05 (2013) 1,86 (2012) 23,3 (2011)<br />
Noruega n.d. 9,0 (2013) n.d. n.d. n.d. 37,4 (2012)<br />
Peru 93,8 (2012) 18,1 (2013) 15,5 (2013) 4,76 (2013) 4,15 (2013) 15,1 (2011)<br />
Reino Uni<strong>do</strong> n.d. 18,4 (2013) 15,9 (2013) 0 (2012) 0 (2012) 38,1 (2012)<br />
Rússia 99,7 (2010) 19,6 (2012) 8,8 (2013) 0,37 (2013) 0,29 (2013) 54,0 (2008)<br />
Suécia n.d. 9,6 (2012) 9,5 (2012) 0 (2013) 1,67 (2013) 34,0 (2012)<br />
Venezuela 95,5 (2009) n.d. n.d. 3,22 (2013) 4,61 (2012) 28,3 (2011)<br />
Fonte: Banco Mundial (2015b).<br />
Tabela 1.12 – Aban<strong>do</strong>no escolar e distorção idade-série no Brasil (%)<br />
Indica<strong>do</strong>r 2007 2008 2009 2010<br />
Aban<strong>do</strong>no no Ensino Fundamental 4,8 4,4 3,7 3,1<br />
Aban<strong>do</strong>no no Ensino Médio 13,2 12,8 11,5 10,3<br />
Distorção idade-série − Fundamental 27,7 22,1 23,3 23,6<br />
Distorção idade-série − Médio 44,8 38,2 38,1 37,8<br />
Fonte: IBGE (2015a).<br />
Observa-se que a proporção de pessoas em faixas de maior tempo de estu<strong>do</strong> vem<br />
aumentan<strong>do</strong> na população brasileira. No entanto, é preocupante notar que, se de 2001 a<br />
2009 houve uma redução na proporção de pessoas sem instrução ou com menos de um