las reformas al sistema de justicia penal - ILANUD
las reformas al sistema de justicia penal - ILANUD
las reformas al sistema de justicia penal - ILANUD

Create successful ePaper yourself
Turn your PDF publications into a flip-book with our unique Google optimized e-Paper software.
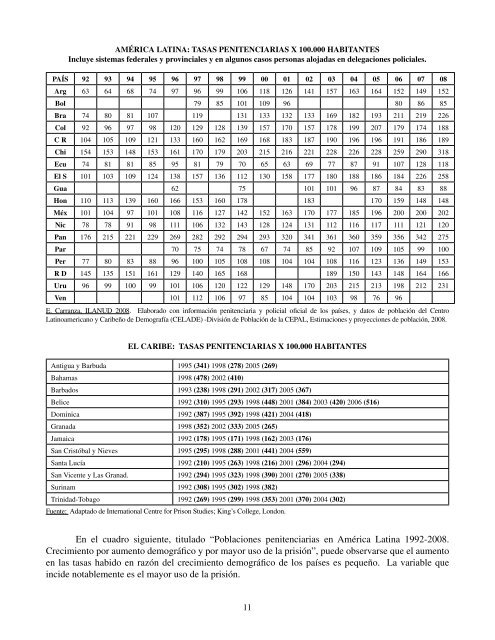
AMÉRICA LATINA: TASAS PENITENCIARIAS X 100.000 HABITANTESIncluye <strong>sistema</strong>s fe<strong>de</strong>r<strong>al</strong>es y provinci<strong>al</strong>es y en <strong>al</strong>gunos casos personas <strong>al</strong>ojadas en <strong>de</strong>legaciones polici<strong>al</strong>es.PAÍS 92 93 94 95 96 97 98 99 00 01 02 03 04 05 06 07 08Arg 63 64 68 74 97 96 99 106 118 126 141 157 163 164 152 149 152Bol 79 85 101 109 96 80 86 85Bra 74 80 81 107 119 131 133 132 133 169 182 193 211 219 226Col 92 96 97 98 120 129 128 139 157 170 157 178 199 207 179 174 188C R 104 105 109 121 133 160 162 169 168 183 187 190 196 196 191 186 189Chi 154 153 148 153 161 170 179 203 215 216 221 228 226 228 259 290 318Ecu 74 81 81 85 95 81 79 70 65 63 69 77 87 91 107 128 118El S 101 103 109 124 138 157 136 112 130 158 177 180 188 186 184 226 258Gua 62 75 101 101 96 87 84 83 88Hon 110 113 139 160 166 153 160 178 183 170 159 148 148Méx 101 104 97 101 108 116 127 142 152 163 170 177 185 196 200 200 202Nic 78 78 91 98 111 106 132 143 128 124 131 112 116 117 111 121 120Pan 176 215 221 229 269 282 292 294 293 320 341 361 360 359 356 342 275Par 70 75 74 78 67 74 85 92 107 109 105 99 100Per 77 80 83 88 96 100 105 108 108 104 104 108 116 123 136 149 153R D 145 135 151 161 129 140 165 168 189 150 143 148 164 166Uru 96 99 100 99 101 106 120 122 129 148 170 203 215 213 198 212 231Ven 101 112 106 97 85 104 104 103 98 76 96E. Carranza, <strong>ILANUD</strong> 2008. Elaborado con información penitenciaria y polici<strong>al</strong> ofici<strong>al</strong> <strong>de</strong> los países, y datos <strong>de</strong> población <strong>de</strong>l CentroLatinoamericano y Caribeño <strong>de</strong> Demografía (CELADE) -División <strong>de</strong> Población <strong>de</strong> la CEPAL, Estimaciones y proyecciones <strong>de</strong> población, 2008.EL CARIBE: TASAS PENITENCIARIAS X 100.000 HABITANTESAntigua y Barbuda 1995 (341) 1998 (278) 2005 (269)Bahamas 1998 (478) 2002 (410)Barbados 1993 (238) 1998 (291) 2002 (317) 2005 (367)Belice 1992 (310) 1995 (293) 1998 (448) 2001 (384) 2003 (420) 2006 (516)Dominica 1992 (387) 1995 (392) 1998 (421) 2004 (418)Granada 1998 (352) 2002 (333) 2005 (265)Jamaica 1992 (178) 1995 (171) 1998 (162) 2003 (176)San Cristób<strong>al</strong> y Nieves 1995 (295) 1998 (288) 2001 (441) 2004 (559)Santa Lucía 1992 (210) 1995 (263) 1998 (216) 2001 (296) 2004 (294)San Vicente y Las Granad. 1992 (294) 1995 (323) 1998 (390) 2001 (270) 2005 (338)Surinam 1992 (308) 1995 (302) 1998 (382)Trinidad-Tobago 1992 (269) 1995 (299) 1998 (353) 2001 (370) 2004 (302)Fuente: Adaptado <strong>de</strong> Internation<strong>al</strong> Centre for Prison Studies; King’s College, London.En el cuadro siguiente, titulado “Poblaciones penitenciarias en América Latina 1992-2008.Crecimiento por aumento <strong>de</strong>mográfico y por mayor uso <strong>de</strong> la prisión”, pue<strong>de</strong> observarse que el aumentoen <strong>las</strong> tasas habido en razón <strong>de</strong>l crecimiento <strong>de</strong>mográfico <strong>de</strong> los países es pequeño. La variable queinci<strong>de</strong> notablemente es el mayor uso <strong>de</strong> la prisión.11