- Page 2:
SCIENTIFIC PAPERSSERIES B. HORTICUL
- Page 5 and 6:
SCIENTIFIC COMMITTEE Bekir Erol AK
- Page 7:
Fructification - Florin Constantin
- Page 10:
Phenological Studies on Some Variet
- Page 14:
Scientific Papers. Series B, Hortic
- Page 17 and 18:
Table 2. The organoleptic appreciat
- Page 19 and 20:
processes become even slower and th
- Page 21 and 22:
- usingselectedbacteriafromm Leucon
- Page 23 and 24:
To organoleptic analysis of the win
- Page 25 and 26:
works were pickling the cucumbers i
- Page 28 and 29:
Scientific Papers. Series B, Hortic
- Page 30 and 31:
days after removal of weeds by burn
- Page 32:
it appears that the culture has gro
- Page 35 and 36:
Maintainance of the genetic structu
- Page 37 and 38:
Table 3. Interaction variety of dwa
- Page 39 and 40: Experimental scheme is situated in
- Page 41 and 42: improvement especially laboratory s
- Page 43 and 44: Table 1 shows the type 2x3x2 trifac
- Page 45 and 46: Neamtu G., Gheorghe Campeanu, Carme
- Page 47 and 48: Experience consisted of the followi
- Page 49 and 50: Table 7. Total production on plantV
- Page 51 and 52: vineyard, several methods were used
- Page 53 and 54: Table 4. Structure and number and r
- Page 56 and 57: Scientific Papers. Series B, Hortic
- Page 58 and 59: gets serious role through the ferme
- Page 60 and 61: Table 3. Element content of the ber
- Page 62 and 63: Scientific Papers. Series B, Hortic
- Page 64 and 65: Figure 4. The length of internodes
- Page 66 and 67: Scientific Papers. Series B, Hortic
- Page 68 and 69: The process of fruit forming was de
- Page 70 and 71: Scientific Papers. Series B, Hortic
- Page 72 and 73: Compomist F1 hybrid reaches value o
- Page 74 and 75: Scientific Papers. Series B, Hortic
- Page 76: Figure 2. Experimental results repr
- Page 79 and 80: and total number of tubers per plan
- Page 81 and 82: and quality of organic potatoes for
- Page 83 and 84: Petri dishes, the pathogenic fungi
- Page 85 and 86: Variant 4R 2 11.0 4.0 15.0 7.0 22.0
- Page 88 and 89: Scientific Papers. Series B, Hortic
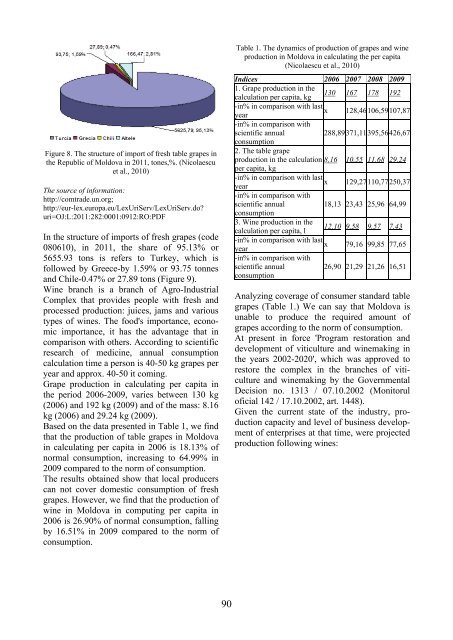
- Page 92 and 93: Table 2. Indicative data on volumes
- Page 94 and 95: Scientific Papers. Series B, Hortic
- Page 96 and 97: Table 3. The Influence of the level
- Page 98 and 99: Table 8. The Influence of irrigatio
- Page 100 and 101: Scientific Papers. Series B, Hortic
- Page 102 and 103: Figure 1. The aspect of apples from
- Page 104: Conclusions on changes in chemicalc
- Page 107 and 108: RESULTS AND DISCUSSIONSRaspberry is
- Page 109 and 110: CONCLUSIONSAs a result of scientifi
- Page 111 and 112: observations were made on phenologi
- Page 113 and 114: Figure 1. Flowering period and blac
- Page 116 and 117: Scientific Papers. Series B, Hortic
- Page 118 and 119: content, A-acidity content) to the
- Page 120 and 121: sugar accumulated in grapes and 1,0
- Page 122 and 123: Scientific Papers. Series B, Hortic
- Page 124 and 125: Figure 2. DryerFigure 3. Programmer
- Page 126 and 127: Appearance of the apricots after 5
- Page 128 and 129: Scientific Papers. Series B, Hortic
- Page 130 and 131: where: P F represent the coordinate
- Page 132 and 133: Scientific Papers. Series B, Hortic
- Page 134 and 135: Table 2. The production obtained at
- Page 136 and 137: As shown in figures 5 and 6 the vit
- Page 138 and 139: Scientific Papers. Series B, Hortic
- Page 140 and 141:
At two weeks from planting it was a
- Page 142 and 143:
If we take into account the both fa
- Page 144 and 145:
Scientific Papers. Series B, Hortic
- Page 146 and 147:
F1 - + infectedF2 - + infectedF3 +
- Page 148:
HORTICULTURALBIODIVERSITY ANDGENETI
- Page 151 and 152:
RESULTS AND DISCUSSIONSFruit charac
- Page 154 and 155:
Scientific Papers. Series B, Hortic
- Page 156 and 157:
The chorology maps of Artemisia alb
- Page 158 and 159:
Figure 5. Chorology of Artemisia le
- Page 160 and 161:
Scientific Papers. Series B, Hortic
- Page 162:
Molecular differentiation showed a
- Page 165 and 166:
The characterization of the grapevi
- Page 167 and 168:
Figure 4. Amino acid profile of the
- Page 169 and 170:
Table 4. The significance of differ
- Page 171 and 172:
The studied phenophases (table 1),
- Page 173 and 174:
REFERENCESCapusan Janina, 2013. Rez
- Page 175 and 176:
Neoaliturus fenestratus Herrich-Sch
- Page 177 and 178:
occurrence in western part of Roman
- Page 179 and 180:
Pop 3 = Population 3 obtained by cr
- Page 181 and 182:
well adapted in our country, and th
- Page 184 and 185:
Scientific Papers. Series B, Hortic
- Page 186 and 187:
Variations in acidity of the variet
- Page 188:
grape. Analele Universitatii din Cr
- Page 191 and 192:
Flow cytometry has proved to be an
- Page 193 and 194:
cell nuclei, using chromosome count
- Page 195 and 196:
Figure 1. Prekos F1Figure 4. Prekos
- Page 197 and 198:
Interpretation of the results conce
- Page 199 and 200:
Photo 1- Redhaven (Control)The Roma
- Page 201 and 202:
Dry matter (determinate refractomet
- Page 203 and 204:
was evaluated by using a large-size
- Page 206 and 207:
Scientific Papers. Series B, Hortic
- Page 208 and 209:
During the growing season have been
- Page 210 and 211:
Scientific Papers. Series B, Hortic
- Page 212 and 213:
Likewise, vitamin C content of ‘G
- Page 214 and 215:
Scientific Papers. Series B, Hortic
- Page 216 and 217:
Figure 2. Air temperature (°C) in
- Page 218:
REFERENCESAnconelli S., Antolini G.
- Page 221 and 222:
Taking into the account these and t
- Page 223 and 224:
postharvest decays in fruits and ve
- Page 225 and 226:
manure semifermentated. In vegetati
- Page 227 and 228:
Figure 1. Prima Cl. 1022 varietyThe
- Page 229 and 230:
temperature required for a differen
- Page 231 and 232:
MATERIALS AND METHODSTo accomplish
- Page 233 and 234:
climate (IH4), becomes for this yea
- Page 235 and 236:
quantities of sugar accumulated in
- Page 237 and 238:
ibosomal to investigate 13 species
- Page 239 and 240:
Biogeography of Genus MangiferaTwo
- Page 241 and 242:
productionand uses. Center for trop
- Page 243 and 244:
analysis of variance to express the
- Page 245 and 246:
highlighted by a correlation coeffi
- Page 247 and 248:
without heat and in open field. Cro
- Page 249 and 250:
ut the fruit had a reduced number o
- Page 251 and 252:
Genetic autochthonous heritage wasi
- Page 253 and 254:
Table 1. The main characteristics o
- Page 256 and 257:
Scientific Papers. Series B, Hortic
- Page 258 and 259:
Data were subjected to statistical
- Page 260 and 261:
Also, the dry biomass and root leng
- Page 262 and 263:
Scientific Papers. Series B, Hortic
- Page 264 and 265:
“Clapp’s Favorite” in 2011 wh
- Page 266:
2012 the order was “Conference”
- Page 269 and 270:
microspore to mature pollen, determ
- Page 271 and 272:
microspores at certain date. Micros
- Page 273 and 274:
viin utilizate ca genitori potentia
- Page 275 and 276:
The objective of this paper, is to
- Page 277 and 278:
Table 1. Relationship between germi
- Page 280 and 281:
Scientific Papers. Series B, Hortic
- Page 282 and 283:
Figure 2. Tassels lengthIn case of
- Page 284:
ORNAMENTAL PLANTS,DESIGN ANDLANDSCA
- Page 287 and 288:
of Chisinau, also the old parks. Fo
- Page 289 and 290:
y cambium on the very center - meth
- Page 291 and 292:
flower is fully colored. Postharves
- Page 293 and 294:
Results from table 8 shows that Mar
- Page 296 and 297:
Scientific Papers. Series B, Hortic
- Page 298 and 299:
Pinus sylvestris ‘Gold Coin’, R
- Page 300 and 301:
Scientific Papers. Series B, Hortic
- Page 302 and 303:
Figure 4. Excelsa (H 18/1)Descripti
- Page 304 and 305:
Scientific Papers. Series B, Hortic
- Page 306 and 307:
Figure 1. Plants in cellular trays
- Page 308:
espectively 69%, followed by hybrid
- Page 311 and 312:
observations made on the plants of
- Page 313 and 314:
The values of pH diminished in all
- Page 315 and 316:
Figure 5. Content of total soluble
- Page 317 and 318:
Figure 1. Plan of Bran domain (Ion
- Page 319 and 320:
Carol the second, her brother, on h
- Page 321 and 322:
Figure 14. Tea house in the natural
- Page 323 and 324:
Cults, and in conformity with the c
- Page 325 and 326:
consult the scientific novelties an
- Page 327 and 328:
,,The restoration is the methodolog
- Page 329 and 330:
MATERIALS AND METHODSThe chorology
- Page 331 and 332:
Merce, 2011; Zamfirescu, 2010) (IAS
- Page 334 and 335:
Scientific Papers. Series B, Hortic
- Page 336 and 337:
experiment because it shows and ill
- Page 338:
among all the administrations, exce
- Page 341 and 342:
solution known as AKN. Content: pot
- Page 343 and 344:
As shown in the figure, Chrysal is
- Page 346 and 347:
Scientific Papers. Series B, Hortic
- Page 348 and 349:
MotivationsOfferprospectingCustomer
- Page 350:
conclude the presented case, with k
- Page 353 and 354:
Also, comparative studies, concerni
- Page 355 and 356:
done before. Also the speed of the
- Page 357 and 358:
as Marcellus theatre or Trajan foru
- Page 359 and 360:
ian regime, by huge contradictions
- Page 361 and 362:
Pyongyang, the hidden cityThe capit
- Page 363 and 364:
“ordinary” buildings as the gen
- Page 365 and 366:
- The Writer’s Rotunda“The cons
- Page 367 and 368:
Figure 4. Vegetation planRegarding
- Page 369 and 370:
Figure 9. BenchesVasesThere are 4 k
- Page 371 and 372:
REFERENCESPanoiu A., 2011, Evolutia
- Page 373 and 374:
RESULTS AND DISCUSSIONSResults of t
- Page 375 and 376:
Figure 5. Average growth rate of
- Page 377 and 378:
In 2012 there were higher onset tem
- Page 379 and 380:
fact that root injuries is the majo
- Page 381 and 382:
We recommend that the species and c
- Page 383 and 384:
and parameters of quality. The phys
- Page 385 and 386:
AESTHETICALLEVEL OFAPPROACHLEVEL OF
- Page 387 and 388:
REFERENCESArchibugi F., 1997. The E
- Page 389 and 390:
Figure 1. Optimized version of comp
- Page 391 and 392:
CONCLUSIONSThe optimized version (F
- Page 394 and 395:
Scientific Papers. Series B, Hortic
- Page 396 and 397:
etween 182-212 g/l, the lowest valu
- Page 398:
CONCLUSIONSThis study showed that 2
- Page 401 and 402:
RESULTS AND DISCUSSIONSFor this pur
- Page 403 and 404:
according to quality class.The calc
- Page 405 and 406:
third party countries who wish to b
- Page 407 and 408:
Stakeholder comments concerned nota
- Page 409 and 410:
Figure 2. The „Eco-leaf” logo o
- Page 411 and 412:
identified to facilitate its tracea
- Page 413 and 414:
- Analysis reports;This document ma
- Page 416 and 417:
Scientific Papers. Series B, Hortic
- Page 418 and 419:
Table 1. Sampling procedures applic
- Page 420 and 421:
Table 2. Example of sampling proced
- Page 422 and 423:
should be 5 kg.” According to thi
- Page 424 and 425:
Scientific Papers. Series B, Hortic
- Page 426 and 427:
One of the first and simplest condi
- Page 428 and 429:
of RIN transcription factor in ethy
- Page 430 and 431:
Scientific Papers. Series B, Hortic
- Page 432 and 433:
oriented towards the centre of the
- Page 434 and 435:
Figure 5. Macroscopic view of the c
- Page 436 and 437:
Related to the process of the evolu
- Page 438 and 439:
Scientific Papers. Series B, Hortic
- Page 440 and 441:
efore it is printed using the main
- Page 442 and 443:
Imposition of the pot is done every
- Page 444 and 445:
Figure 8. Test of Strength Vetiver
- Page 446 and 447:
Scientific Papers. Series B, Hortic
- Page 448 and 449:
Table 3 defines LSD test for genoty