- Page 6:
6PARTE 2TÉCNICAS PROJETIVAS, PRÁT
- Page 9 and 10:
9PARTE 4AVALIAÇÃO PSICOLÓGICA E
- Page 13 and 14:
13que as pessoas estão dispostas e
- Page 15 and 16:
15mostrado que a validade convergen
- Page 17 and 18:
17Objetivos específicos‐ Verific
- Page 19 and 20:
19participavam da pesquisa quer sej
- Page 21 and 22:
21A Tabela 2 mostra os resultados d
- Page 23 and 24:
23Todas as variáveis do Rorschach,
- Page 25 and 26:
25como: MMPI, NEO‐PI, EPQ e o pr
- Page 27 and 28:
27Resende, A.C. & Garcia‐Santos,
- Page 29 and 30:
29Pesquisadores de todo o mundo (Re
- Page 31 and 32:
31Ainda na linha de investigação
- Page 33 and 34:
33MÉTODOParticipantesForam examina
- Page 35 and 36:
35A análise dos resultados foi pau
- Page 37 and 38:
37Tabela 1: Análise estatística i
- Page 39 and 40:
39(H)F 78 /1991M 65 /1715HdF 174 /1
- Page 41 and 42:
41Diante do que foi mostrado, consi
- Page 43 and 44:
43(2010) e Raspantini (2010) com os
- Page 45 and 46:
45Matsumoto, M., Morita, M., Suzuki
- Page 47 and 48:
47O PSICODIAGNÓSTICO DE RORSCHACH
- Page 49 and 50:
49propicia liberdade de interpreta
- Page 51 and 52:
51Andronikof et al. 2008 França 12
- Page 53 and 54:
53teórico‐técnicos, o Rorschach
- Page 55 and 56:
55relacionadas à produtividade e a
- Page 57 and 58:
57DoPartPubl‐‐‐‐ ‐ ‐F+P
- Page 59 and 60: 59SexPartPubl 1/20313/16750,10,20,2
- Page 61 and 62: 61Já as crianças mostraram poucas
- Page 63 and 64: 63Cunha, J. A. (2000). Estratégias
- Page 65 and 66: 65Noronha, A. P. P., Primi, R. & Al
- Page 67 and 68: 67O TESTE DAS PIRÂMIDES COLORIDAS
- Page 69 and 70: 69Tendo em vista o constante aprimo
- Page 71 and 72: 71Voltando à busca por validação
- Page 73 and 74: 73MÉTODOParticipantesPretende‐se
- Page 75 and 76: 75Amaral, A.E., 2005), possui dez c
- Page 77 and 78: 77normas de adolescentes de 1978, p
- Page 79 and 80: 79VermelhoVerdeVioletaLaranjaAmarel
- Page 81 and 82: 81aprimorados e interpretados com m
- Page 83 and 84: 83Villemor‐Amaral, A. E., Primi,
- Page 85 and 86: 85forma, compreensão acerca da est
- Page 87 and 88: 87levantam dados acerca da represen
- Page 89 and 90: 89Os dados examinados neste trabalh
- Page 91 and 92: 91Variável Grupo n Proporção % p
- Page 93 and 94: 93Variável Grupo n Proporção % p
- Page 95 and 96: 95psicológica. Essa hipótese pare
- Page 97 and 98: 97dos resultados relativos às fór
- Page 99 and 100: 99estas específicas amostras de in
- Page 101 and 102: 101Pasian, S. R. & Loureiro, S. R.
- Page 103 and 104: 103been characterized as too time
- Page 105 and 106: 105regarding new international norm
- Page 107 and 108: 107shaking hands.” Obviously, the
- Page 109: 109biggest differences and problems
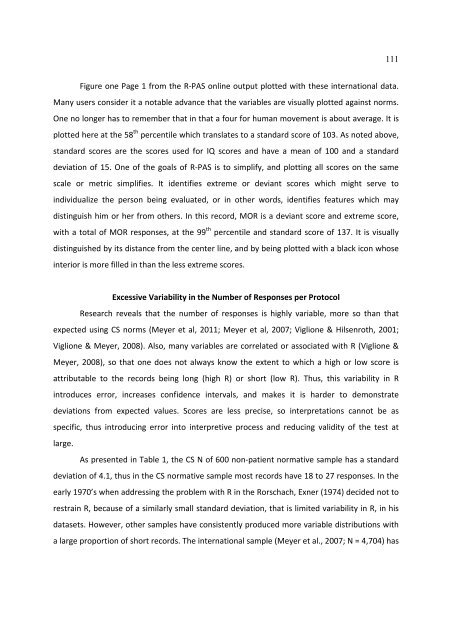
- Page 113 and 114: 113standard deviations below five.
- Page 115 and 116: 115drawers.” Do not code simple a
- Page 117 and 118: 117The Impact on R‐PASThe impact
- Page 119 and 120: 119Table 1Comparison of CS norms to
- Page 121 and 122: 121Figure 1R‐PAS Summary Scores a
- Page 123 and 124: 123Meyer, G. J., Hsiao, W.‐C., Vi
- Page 125 and 126: 125Assessment Psychology (Vol. 10,
- Page 127 and 128: 127ANSIEDADE SITUACIONAL DURANTE A
- Page 129 and 130: 129exemplo, pelo tempo de reação
- Page 131 and 132: 131da Universidade Federal da Para
- Page 133 and 134: 133O avaliado visualizou um monstro
- Page 135 and 136: 135Traubenberg, N.R. (1998). A Prá
- Page 137 and 138: 137em instituições à medida em q
- Page 139 and 140: 139contribuição do teste projetiv
- Page 141 and 142: 141MÉTODOPara avaliação de resul
- Page 143 and 144: 143Prancha 2: avalia as relações
- Page 145 and 146: 145História: “Aqui para mim é u
- Page 147 and 148: 147ela tinha que deixar esse boneco
- Page 149 and 150: 149Na primeira, parece que se ident
- Page 151 and 152: 151REFERÊNCIASBraier, E. A. (2000)
- Page 153 and 154: 153valorização de si própria, po
- Page 155 and 156: 155DFH 23* 41,5Bender 6* 7,5Desenho
- Page 157 and 158: 157gráficas nesse contexto, revela
- Page 159 and 160: 159Silva, M. F. X. da; Villemor‐A
- Page 161 and 162:
161influenciado por diversos fatore
- Page 163 and 164:
163dados para a realização de um
- Page 165 and 166:
165b) Teste de Fotos de Profissões
- Page 167 and 168:
167RESULTADOS E DISCUSSÃOEscala de
- Page 169 and 170:
169produtividade pode ser indicador
- Page 171 and 172:
171assinalando uma característica
- Page 173 and 174:
173construção do conhecimento sob
- Page 175 and 176:
175Jacquemin, A. (2000). O BBT‐Br
- Page 177 and 178:
177DALTONISMO E CARACTERÍSTICAS AF
- Page 179 and 180:
179de cones azuis. Estes autores ta
- Page 181 and 182:
181(WSumC:SumC’); o número de re
- Page 183 and 184:
183Quadro 3: Comparativo dos result
- Page 185 and 186:
185nos relacionamentos interpessoai
- Page 187 and 188:
187dificuldade em enxergar as cores
- Page 189 and 190:
189obtido no Palográfico. Apesar d
- Page 191 and 192:
191DESENHOS DE CRIANÇAS BRASILEIRA
- Page 193 and 194:
193Viertler (1976) informa que exis
- Page 195 and 196:
195Desenho de um menino GuaraniOs K
- Page 197 and 198:
197Os Mayo de Sonora, MéxicoOs May
- Page 199 and 200:
199Tzotzil de Chamula, Chiapas, Mé
- Page 201 and 202:
201Náhuatl de Guerrero, MéxicoA l
- Page 203 and 204:
203(denominada umbigo). De acordo c
- Page 205 and 206:
205REFERÊNCIASBoggiani, G. (1975).
- Page 207 and 208:
207maior o grau de congruência, me
- Page 209 and 210:
209escolha da carreira envolve tamb
- Page 211 and 212:
211(3) Dentre os cursos em que o in
- Page 213 and 214:
213RESULTADOSA seguir serão descri
- Page 215 and 216:
215Com relação ao grupo feminino,
- Page 217 and 218:
217esperados num perfil de exatas,
- Page 219 and 220:
219Recuperado em 28 de março de 20
- Page 221 and 222:
221INCLINAÇÃO PROFISSIONAL E SATI
- Page 223 and 224:
223A orientação profissional é u
- Page 225 and 226:
225Em 1963 as fotos foram atualizad
- Page 227 and 228:
227alunos que compuseram esses grup
- Page 229 and 230:
229Quadro 2. Comparação dos fator
- Page 231 and 232:
231Noce, M.A.; Okino, E.T.K.; Asson
- Page 233 and 234:
233de tipo compreensivo (Trinca, 19
- Page 235 and 236:
235ser tratados como sujeitos e pes
- Page 237 and 238:
237Um dos artigos do Estatuto mostr
- Page 239 and 240:
239Azevedo, M. A., & Guerra, V. N.
- Page 241 and 242:
241A UTILIZAÇÃO DO PROCEDIMENTO D
- Page 243 and 244:
243 Entende‐se que, nas provas pr
- Page 245 and 246:
245EXEMPLOS DE PESQUISAS DE INICIA
- Page 247 and 248:
247Os dados a seguir pautaram‐se
- Page 249 and 250:
249representação simbólica do pa
- Page 251 and 252:
251participante que realizasse um d
- Page 253 and 254:
253as defesas assinaladas demonstra
- Page 255 and 256:
255Comunicação Científica da Reu
- Page 257 and 258:
257Pillotti (1988) ressalta que est
- Page 259 and 260:
259a inserção dela em sua cultura
- Page 261 and 262:
261Desta maneira, tal pesquisa apre
- Page 263 and 264:
263RESULTADOS E DISCUSSÃOTendo em
- Page 265 and 266:
265Levinzon, G. K. (2009). Adoção
- Page 267 and 268:
267AUTOPERCEPÇÃO EM ESTUDANTES DE
- Page 269 and 270:
269Sendo assim, quando há presenç
- Page 271 and 272:
271pensar, sentir e se comportar em
- Page 273 and 274:
273esclarecido, o participante pree
- Page 275 and 276:
275Determinantes (11 variáveis) 0.
- Page 277 and 278:
277mais tendência a superestimar o
- Page 279 and 280:
279Kakeshita, I. S. & Almeida S. S.
- Page 281 and 282:
281Economia, Contabilidade, Adminis
- Page 283 and 284:
283Profissões - BBT‐Br, método
- Page 285 and 286:
285como ele organiza suas escolhas,
- Page 287 and 288:
287Estruturas de inclinação profi
- Page 289 and 290:
289Tabela 3: Estruturas de inclina
- Page 291 and 292:
291Tabela 4: Fotos do BBT‐Br mais
- Page 293 and 294:
293Primeiramente, destaca‐se que
- Page 295 and 296:
295Brasil. Ministério do Trabalho
- Page 297 and 298:
297REFLEXÕES SOBRE AVALIAÇÃO PSI
- Page 299 and 300:
299apresentados anteriormente. Esta
- Page 301 and 302:
301à dificuldade de comunicação
- Page 303 and 304:
303de adaptação. Dado também obs
- Page 305 and 306:
305UM ENSAIO ACERCA DO TESTE PSICOL
- Page 307 and 308:
307É possível realizar o teste co
- Page 309 and 310:
309REFERÊNCIASCunha, J. A., et al.
- Page 311 and 312:
311Dentre as variáveis psicológic
- Page 313 and 314:
313al., 2006), parecer favorável d
- Page 315 and 316:
315conforme mencionado anteriorment
- Page 317 and 318:
31717.65% 17.65% 12.75% 26.47% 7.84
- Page 319 and 320:
319campo, a distribuição de moça
- Page 321 and 322:
321importante ressaltar que os resu
- Page 323 and 324:
323Primi, R.; Mansão, C. M.; Muniz
- Page 325 and 326:
325A ABORDAGEM PSICODINÂMICA COMO
- Page 327 and 328:
327Por suas propriedades, Anzieu (1
- Page 329 and 330:
329Por intermédio dos itens de cod
- Page 331 and 332:
331Como citam Cunha et al. (1993),
- Page 333 and 334:
333além do que é apresentado pela
- Page 335 and 336:
335categoria, de acordo com os iten
- Page 337 and 338:
337• Aspectos de reprodução e s
- Page 339 and 340:
339Castro, P.F. (2008). Caracteriza
- Page 341 and 342:
341O MÉTODO DE RORSCHACH NO ENFOQU
- Page 343 and 344:
343foram herdadas assim como os ins
- Page 345 and 346:
345influenciava suas atitudes frent
- Page 347 and 348:
347sequência, que corresponde a es
- Page 349 and 350:
349A prancha VII, tanto na posiçã
- Page 351 and 352:
351REFERÊNCIASCassirer, E. (1951).
- Page 353 and 354:
353o objetivo secundário procura r
- Page 355 and 356:
355Este primeiro desenho da figura
- Page 357 and 358:
357em consulta, nada mudou com o pa
- Page 359 and 360:
359mais social, ter outros repertó
- Page 361 and 362:
361dois olhos.X ^ < v > ^ > v Lembr
- Page 363 and 364:
363aparecem como tentativas de lida
- Page 365 and 366:
365esclarecem que em razão de sua
- Page 367 and 368:
367Na maior parte dos casos de tran
- Page 369 and 370:
369tratamento de pânico, associand
- Page 371 and 372:
371equivalentes aos obtidos no Grup
- Page 373 and 374:
373social. Apesar dos valores não
- Page 375 and 376:
375os padrões brasileiros e també
- Page 377 and 378:
377Como é possível verificar na T
- Page 379 and 380:
379Arbona, C.B. & Arnal, R.B. (1995
- Page 381 and 382:
381Schwartzman, R.S. (1997). Síndr
- Page 383 and 384:
383No Brasil têm‐se percentuais
- Page 385 and 386:
385ProcedimentosInicialmente foi re
- Page 387 and 388:
387Neste sentido, o Método de Rors
- Page 389 and 390:
PARTE 4AVALIAÇÃO PSICOLÓGICA E C
- Page 391 and 392:
391d'une façon tout à la fois nou
- Page 393 and 394:
393émerge lors de l’assèchement
- Page 395 and 396:
395Femme, 85 ans« Deux bonshommes
- Page 397 and 398:
397On le voit, si une sensibilité
- Page 399 and 400:
399Femme, 75 ansPlanche II : « C
- Page 401 and 402:
401D’autres réponses mettent dav
- Page 403 and 404:
403Pontalis a utilisé une métapho
- Page 405 and 406:
405Mattlar C.E., Knuts L.R. et Virt
- Page 407 and 408:
407REVISÃO DE ARTIGOS BRASILEIROS
- Page 409 and 410:
409Por fim, sugere‐se que o profi
- Page 411 and 412:
411CONSIDERAÇÕES FINAISEste traba
- Page 413 and 414:
413segundo Laplanche e Pontalis (19
- Page 415 and 416:
415Árvore‐Pessoa), investigando
- Page 417 and 418:
417nesses casos a contribuição do
- Page 419 and 420:
419Embora “parecendo” apresenta
- Page 421 and 422:
421CONSIDERAÇÕES FINAISEstes resu
- Page 423 and 424:
423Laplanche, J. : Pontalis, J.‐B
- Page 425 and 426:
425cartas, sendo este quatro anos m
- Page 427 and 428:
427A segunda desilusão amorosa 2 f
- Page 429 and 430:
429A castração ocorre quando a fu
- Page 431 and 432:
431mas agora, como acontece com tan
- Page 433 and 434:
433ou do corpo sobre a carne, ou do
- Page 435 and 436:
435fonte rica de poesia e arte, com
- Page 437 and 438:
437PROJEÇÕES DE VINCENT VAN GOGH:
- Page 439 and 440:
439papel com muito sentimento. Pode
- Page 441 and 442:
441CONSIDERAÇÕES FINAISA partir d
- Page 443 and 444:
443LE RORSCHACH EN CLINIQUE DE L'EN
- Page 445 and 446:
445penser que le dispositif vient s
- Page 447 and 448:
447travers de cette déconstruction
- Page 449 and 450:
449passation, fragilité de la cons
- Page 451 and 452:
451La cotationOn peut envisager que
- Page 453 and 454:
453Je n’ai pas le temps ici d’e
- Page 455 and 456:
455investissements de la vie famili
- Page 457 and 458:
457proprement parler et le temps de
- Page 459 and 460:
459ADOLESCENTE DEFICIENTE FÍSICA V
- Page 461 and 462:
461MÉTODOSujeito participanteAdole
- Page 463 and 464:
463sair com a mãe (o que ocorria m
- Page 465 and 466:
465Tabela 3: Características afeti
- Page 467 and 468:
467Porém, o resultado encontrado c
- Page 469 and 470:
469Gallardo Cruz, A. J. (1994). Mau
- Page 471 and 472:
471destacam‐se principalmente a i
- Page 473 and 474:
473repentina (Exner & Sendín, 1999
- Page 475 and 476:
475disponibilizaram a colaborar com
- Page 477 and 478:
477parte dos adolescentes deste est
- Page 479 and 480:
4797 X8 X*9 ‐ ‐ ‐ ‐10 X11 X
- Page 481 and 482:
481bastante frequentes em traços p
- Page 483 and 484:
483conseqüências de suas ações
- Page 485 and 486:
485práticas nos campos clínicos,
- Page 487 and 488:
487o registro do Jornal “O Alvar
- Page 489 and 490:
489rejeição emocional dos pais, c
- Page 491 and 492:
491com crianças desajustadas), con
- Page 493 and 494:
493como o grau e liberdade e a ambi
- Page 495 and 496:
495recrutamento de famílias de nã
- Page 497 and 498:
497observadora e colaborou no manej
- Page 499 and 500:
499Tabela 4: Tipo de interação na
- Page 501 and 502:
50134 42 16 92 X 2 = 1,37 X 2 = 0,3
- Page 503 and 504:
503regras ao invés de princípios,
- Page 505 and 506:
505Ferreira, A. J (1963). Decision
- Page 507 and 508:
PARTE 6MÉTODOS PROJETIVOS E DEMAND
- Page 509 and 510:
509Nas avaliações da área de seg
- Page 511 and 512:
511A opção por técnicas projetiv
- Page 513 and 514:
513segurança, seleções na área
- Page 515 and 516:
515de uma avaliação realizada com
- Page 517 and 518:
517AFETIVIDADE E RELAÇÕES INTERPE
- Page 519 and 520:
519Na primeira infância (até os d
- Page 521 and 522:
521crianças atendidas no serviço
- Page 523 and 524:
523‐ pacientes com DA grave, ou s
- Page 525 and 526:
525A proporção FC : CF + C (3 : 2
- Page 527 and 528:
527CONSIDERAÇÕES FINAISPode‐se
- Page 529 and 530:
529ANÁLISE DOS RECURSOS COGNITIVOS
- Page 531 and 532:
531representou uma enorme abertura
- Page 533 and 534:
533dois surtos. A evolução da EM
- Page 535 and 536:
535curso de tratamento, este pode s
- Page 537 and 538:
537(2000), o QSG foi delineado para
- Page 539 and 540:
539Tabela 2: Análise do comprometi
- Page 541 and 542:
541É possível observar diferença
- Page 543 and 544:
543Tabela 6: Análise da Qualidade
- Page 545 and 546:
545Exner, J.E. (1999). Manual de cl
- Page 547 and 548:
547LIMITES E CONTRIBUIÇÕES DOS IN
- Page 549 and 550:
5493. Limitações na reconstruçã
- Page 551 and 552:
551terceira variável que a interme
- Page 553 and 554:
553Rorschach, os indicadores levant
- Page 555 and 556:
555Melton, G.B.; Petrila, J.; Poyth
- Page 557 and 558:
557(1935), que tinham como objetivo
- Page 559 and 560:
559Rorschach, o Psicodiagnóstico M
- Page 561 and 562:
561O estudo de Wechsler (2003) perm
- Page 563 and 564:
563MPS TestCSFQ ‐ Coercive Sexual
- Page 565 and 566:
565Gomila (2005), na Espanha, faz u
- Page 567 and 568:
567resultados obtidos nos Desenhos
- Page 569 and 570:
569Marconi, M. A., & Lakatos, E. M.
- Page 571 and 572:
571O processo de avaliação ou de
- Page 573 and 574:
573Necessidades de compreensão ps
- Page 575 and 576:
575 ADOLEC BRASIL ‐ Saúde de Ado
- Page 577 and 578:
577Tabela 2. Periódicos responsáv
- Page 579 and 580:
579Tabela 4. Quantidade de autores
- Page 581 and 582:
581Tabela 6. Participantes / Fonte
- Page 583 and 584:
583A área de investigação consti
- Page 585 and 586:
585Importante salientar a necessida
- Page 587 and 588:
587Fernandes, M.A. (2000). O trabal
- Page 589 and 590:
589Witter, G.P. (org.). (1999). Pro
- Page 591 and 592:
591entender da comissão avaliam de