Informe anual (pdf) - Cajastur
Informe anual (pdf) - Cajastur
Informe anual (pdf) - Cajastur

Create successful ePaper yourself
Turn your PDF publications into a flip-book with our unique Google optimized e-Paper software.
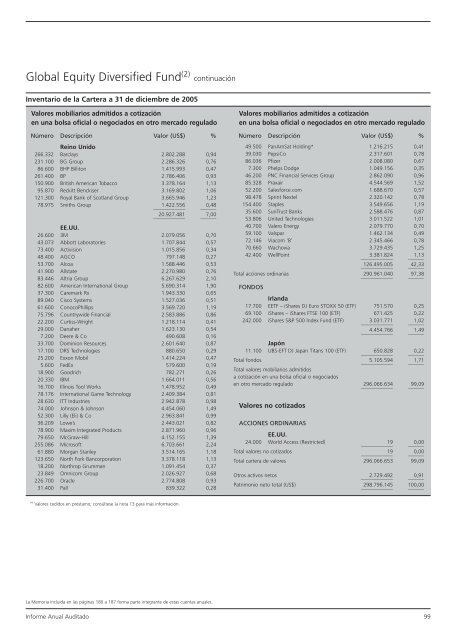
Global Equity Diversified Fund (2) continuación<br />
Inventario de la Cartera a 31 de diciembre de 2005<br />
Valores mobiliarios admitidos a cotización<br />
en una bolsa oficial o negociados en otro mercado regulado<br />
Número Descripción Valor (US$) %<br />
Reino Unido<br />
266.332 Barclays 2.802.288 0,94<br />
231.100 BG Group 2.286.326 0,76<br />
86.600 BHP Billiton 1.415.993 0,47<br />
261.400 BP 2.786.406 0,93<br />
150.900 British American Tobacco 3.378.164 1,13<br />
95.870 Reckitt Benckiser 3.169.802 1,06<br />
121.300 Royal Bank of Scotland Group 3.665.946 1,23<br />
78.975 Smiths Group<br />
____________<br />
1.422.556<br />
______<br />
0,48<br />
____________<br />
20.927.481<br />
______<br />
7,00<br />
EE.UU.<br />
26.600 3M 2.079.056 0,70<br />
43.073 Abbott Laboratories 1.707.844 0,57<br />
73.400 Activision 1.015.856 0,34<br />
48.400 AGCO 797.148 0,27<br />
53.700 Alcoa 1.588.446 0,53<br />
41.900 Allstate 2.270.980 0,76<br />
83.446 Altria Group 6.267.629 2,10<br />
82.600 American International Group 5.690.314 1,90<br />
37.300 Caremark Rx 1.943.330 0,65<br />
89.040 Cisco Systems 1.527.036 0,51<br />
61.600 ConocoPhillips 3.569.720 1,19<br />
75.796 Countrywide Financial 2.583.886 0,86<br />
22.200 Curtiss-Wright 1.218.114 0,41<br />
29.000 Danaher 1.623.130 0,54<br />
7.200 Deere & Co 490.608 0,16<br />
33.700 Dominion Resources 2.601.640 0,87<br />
17.100 DRS Technologies 880.650 0,29<br />
25.200 Exxon Mobil 1.414.224 0,47<br />
5.600 FedEx 579.600 0,19<br />
18.900 Goodrich 782.271 0,26<br />
20.330 IBM 1.664.011 0,56<br />
16.700 Illinois Tool Works 1.478.952 0,49<br />
78.176 International Game Technology 2.409.384 0,81<br />
28.630 ITT Industries 2.942.878 0,98<br />
74.000 Johnson & Johnson 4.454.060 1,49<br />
52.300 Lilly (Eli) & Co 2.963.841 0,99<br />
36.209 Lowe’s 2.443.021 0,82<br />
78.900 Maxim Integrated Products 2.871.960 0,96<br />
79.650 McGraw-Hill 4.152.155 1,39<br />
255.086 Microsoft 6.703.661 2,24<br />
61.880 Morgan Stanley 3.514.165 1,18<br />
123.650 North Fork Bancorporation 3.378.118 1,13<br />
18.200 Northrop Grumman 1.091.454 0,37<br />
23.849 Omnicom Group 2.026.927 0,68<br />
226.700 Oracle 2.774.808 0,93<br />
31.400 Pall 839.322 0,28<br />
Valores mobiliarios admitidos a cotización<br />
en una bolsa oficial o negociados en otro mercado regulado<br />
Número Descripción Valor (US$) %<br />
49.500 PanAmSat Holding* 1.216.215 0,41<br />
39.030 PepsiCo 2.317.601 0,78<br />
86.036 Pfizer 2.008.080 0,67<br />
7.300 Phelps Dodge 1.049.156 0,35<br />
46.200 PNC Financial Services Group 2.862.090 0,96<br />
85.328 Praxair 4.544.569 1,52<br />
52.200 Salesforce.com 1.688.670 0,57<br />
98.478 Sprint Nextel 2.320.142 0,78<br />
154.400 Staples 3.549.656 1,19<br />
35.600 SunTrust Banks 2.588.476 0,87<br />
53.806 United Technologies 3.011.522 1,01<br />
40.700 Valero Energy 2.079.770 0,70<br />
59.100 Valspar 1.462.134 0,49<br />
72.146 Viacom ‘B’ 2.345.466 0,78<br />
70.660 Wachovia 3.729.435 1,25<br />
42.400 WellPoint<br />
____________<br />
3.381.824<br />
______<br />
1,13<br />
____________<br />
126.495.005<br />
______<br />
42,33<br />
Total acciones ordinarias<br />
____________<br />
290.961.040<br />
______<br />
97,38<br />
FONDOS<br />
Irlanda<br />
17.700 EETF – iShares DJ Euro STOXX 50 (ETF) 751.570 0,25<br />
69.100 iShares – iShares FTSE 100 (ETF) 671.425 0,22<br />
242.000 iShares S&P 500 Index Fund (ETF)<br />
____________<br />
3.031.771<br />
______<br />
1,02<br />
____________<br />
4.454.766<br />
______<br />
1,49<br />
Japón<br />
11.100 UBS-EFT DJ Japan Titans 100 (ETF)<br />
____________<br />
650.828<br />
______<br />
0,22<br />
Total fondos<br />
____________<br />
5.105.594<br />
______<br />
1,71<br />
Total valores mobiliarios admitidos<br />
a cotización en una bolsa oficial o negociados<br />
en otro mercado regulado<br />
____________<br />
296.066.634<br />
______<br />
99,09<br />
Valores no cotizados<br />
ACCIONES ORDINARIAS<br />
EE.UU.<br />
24.000 World Access (Restricted)<br />
____________<br />
19<br />
______<br />
0,00<br />
Total valores no cotizados<br />
____________<br />
19<br />
______<br />
0,00<br />
Total cartera de valores 296.066.653 99,09<br />
Otros activos netos<br />
____________<br />
2.729.492<br />
______<br />
0,91<br />
Patrimonio neto total (US$)<br />
____________<br />
298.796.145 100,00<br />
______<br />
(*) Valores cedidos en préstamo; consúltese la nota 13 para más información.<br />
La Memoria incluida en las páginas 180 a 187 forma parte integrante de estas cuentas <strong>anual</strong>es.<br />
<strong>Informe</strong> Anual Auditado 99