Informe anual (pdf) - Cajastur
Informe anual (pdf) - Cajastur
Informe anual (pdf) - Cajastur

Create successful ePaper yourself
Turn your PDF publications into a flip-book with our unique Google optimized e-Paper software.
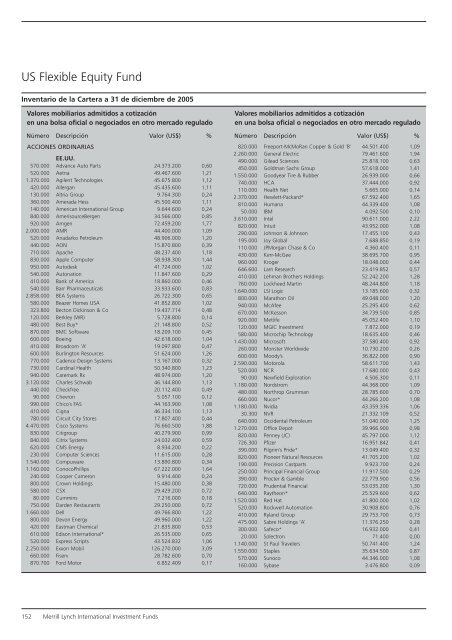
US Flexible Equity Fund<br />
Inventario de la Cartera a 31 de diciembre de 2005<br />
Valores mobiliarios admitidos a cotización<br />
en una bolsa oficial o negociados en otro mercado regulado<br />
Número Descripción Valor (US$) %<br />
ACCIONES ORDINARIAS<br />
EE.UU.<br />
570.000 Advance Auto Parts 24.373.200 0,60<br />
520.000 Aetna 49.467.600 1,21<br />
1.370.000 Agilent Technologies 45.675.800 1,12<br />
420.000 Allergan 45.435.600 1,11<br />
130.000 Altria Group 9.764.300 0,24<br />
360.000 Amerada Hess 45.500.400 1,11<br />
140.000 American International Group 9.644.600 0,24<br />
840.000 AmerisourceBergen 34.566.000 0,85<br />
920.000 Amgen 72.459.200 1,77<br />
2.000.000 AMR 44.400.000 1,09<br />
520.000 Anadarko Petroleum 48.906.000 1,20<br />
440.000 AON 15.870.800 0,39<br />
710.000 Apache 48.237.400 1,18<br />
830.000 Apple Computer 58.938.300 1,44<br />
950.000 Autodesk 41.724.000 1,02<br />
540.000 Autonation 11.847.600 0,29<br />
410.000 Bank of America 18.860.000 0,46<br />
540.000 Barr Pharmaceuticals 33.933.600 0,83<br />
2.858.000 BEA Systems 26.722.300 0,65<br />
580.000 Beazer Homes USA 41.852.800 1,02<br />
323.800 Becton Dickinson & Co 19.437.714 0,48<br />
120.000 Berkley (WR) 5.728.800 0,14<br />
480.000 Best Buy* 21.148.800 0,52<br />
870.000 BMC Software 18.209.100 0,45<br />
600.000 Boeing 42.618.000 1,04<br />
410.000 Broadcom ’A’ 19.097.800 0,47<br />
600.000 Burlington Resources 51.624.000 1,26<br />
770.000 Cadence Design Systems 13.167.000 0,32<br />
730.000 Cardinal Health 50.340.800 1,23<br />
940.000 Caremark Rx 48.974.000 1,20<br />
3.120.000 Charles Schwab 46.144.800 1,13<br />
440.000 Checkfree 20.112.400 0,49<br />
90.000 Chevron 5.057.100 0,12<br />
990.000 Chico’s FAS 44.163.900 1,08<br />
410.000 Cigna 46.334.100 1,13<br />
780.000 Circuit City Stores 17.807.400 0,44<br />
4.470.000 Cisco Systems 76.660.500 1,88<br />
830.000 Citigroup 40.279.900 0,99<br />
840.000 Citrix Systems 24.032.400 0,59<br />
620.000 CMS Energy 8.934.200 0,22<br />
230.000 Computer Sciences 11.615.000 0,28<br />
1.540.000 Compuware 13.890.800 0,34<br />
1.160.000 ConocoPhillips 67.222.000 1,64<br />
240.000 Cooper Cameron 9.914.400 0,24<br />
800.000 Crown Holdings 15.480.000 0,38<br />
580.000 CSX 29.429.200 0,72<br />
80.000 Cummins 7.216.000 0,18<br />
750.000 Darden Restaurants 29.250.000 0,72<br />
1.660.000 Dell 49.766.800 1,22<br />
800.000 Devon Energy 49.960.000 1,22<br />
420.000 Eastman Chemical 21.835.800 0,53<br />
610.000 Edison International* 26.535.000 0,65<br />
520.000 Express Scripts 43.524.832 1,06<br />
2.250.000 Exxon Mobil 126.270.000 3,09<br />
660.000 Fiserv 28.782.600 0,70<br />
870.700 Ford Motor 6.852.409 0,17<br />
Valores mobiliarios admitidos a cotización<br />
en una bolsa oficial o negociados en otro mercado regulado<br />
Número Descripción Valor (US$) %<br />
820.000 Freeport-McMoRan Copper & Gold ’B’ 44.501.400 1,09<br />
2.260.000 General Electric 79.461.600 1,94<br />
490.000 Gilead Sciences 25.818.100 0,63<br />
450.000 Goldman Sachs Group 57.618.000 1,41<br />
1.550.000 Goodyear Tire & Rubber 26.939.000 0,66<br />
740.000 HCA 37.444.000 0,92<br />
110.000 Health Net 5.665.000 0,14<br />
2.370.000 Hewlett-Packard* 67.592.400 1,65<br />
810.000 Humana 44.339.400 1,08<br />
50.000 IBM 4.092.500 0,10<br />
3.610.000 Intel 90.611.000 2,22<br />
820.000 Intuit 43.952.000 1,08<br />
290.000 Johnson & Johnson 17.455.100 0,43<br />
195.000 Joy Global 7.688.850 0,19<br />
110.000 JPMorgan Chase & Co 4.360.400 0,11<br />
430.000 Kerr-McGee 38.695.700 0,95<br />
960.000 Kroger 18.048.000 0,44<br />
646.600 Lam Research 23.419.852 0,57<br />
410.000 Lehman Brothers Holdings 52.242.200 1,28<br />
760.000 Lockheed Martin 48.244.800 1,18<br />
1.640.000 LSI Logic 13.185.600 0,32<br />
800.000 Marathon Oil 49.048.000 1,20<br />
940.000 McAfee 25.295.400 0,62<br />
670.000 McKesson 34.739.500 0,85<br />
920.000 Metlife 45.052.400 1,10<br />
120.000 MGIC Investment 7.872.000 0,19<br />
580.000 Microchip Technology 18.635.400 0,46<br />
1.430.000 Microsoft 37.580.400 0,92<br />
260.000 Monster Worldwide 10.730.200 0,26<br />
600.000 Moody’s 36.822.000 0,90<br />
2.590.000 Motorola 58.611.700 1,43<br />
520.000 NCR 17.680.000 0,43<br />
90.000 Newfield Exploration 4.506.300 0,11<br />
1.180.000 Nordstrom 44.368.000 1,09<br />
480.000 Northrop Grumman 28.785.600 0,70<br />
660.000 Nucor* 44.266.200 1,08<br />
1.180.000 Nvidia 43.359.336 1,06<br />
30.300 NVR 21.332.109 0,52<br />
640.000 Occidental Petroleum 51.040.000 1,25<br />
1.270.000 Office Depot 39.966.900 0,98<br />
820.000 Penney (JC) 45.797.000 1,12<br />
726.300 Pfizer 16.951.842 0,41<br />
390.000 Pilgrim’s Pride* 13.049.400 0,32<br />
820.000 Pioneer Natural Resources 41.705.200 1,02<br />
190.000 Precision Castparts 9.923.700 0,24<br />
250.000 Principal Financial Group 11.917.500 0,29<br />
390.000 Procter & Gamble 22.779.900 0,56<br />
720.000 Prudential Financial 53.035.200 1,30<br />
640.000 Raytheon* 25.529.600 0,62<br />
1.520.000 Red Hat 41.800.000 1,02<br />
520.000 Rockwell Automation 30.908.800 0,76<br />
410.000 Ryland Group 29.753.700 0,73<br />
475.000 Sabre Holdings ’A’ 11.376.250 0,28<br />
300.000 Safeco* 16.932.000 0,41<br />
20.000 Solectron 71.400 0,00<br />
1.140.000 St Paul Travelers 50.741.400 1,24<br />
1.550.000 Staples 35.634.500 0,87<br />
570.000 Sunoco 44.346.000 1,08<br />
160.000 Sybase 3.476.800 0,09<br />
152 Merrill Lynch International Investment Funds