Informe anual (pdf) - Cajastur
Informe anual (pdf) - Cajastur
Informe anual (pdf) - Cajastur

Create successful ePaper yourself
Turn your PDF publications into a flip-book with our unique Google optimized e-Paper software.
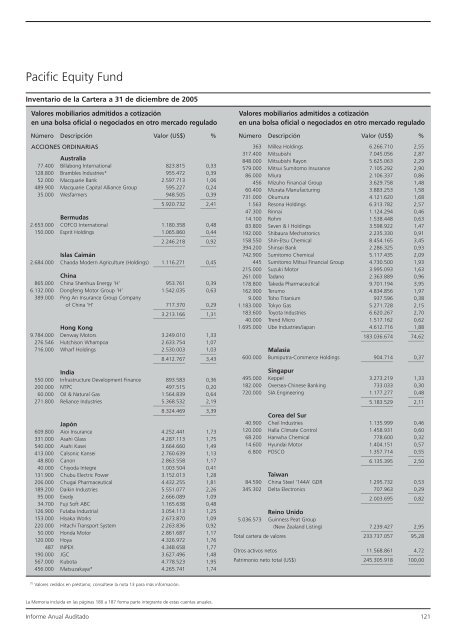
Pacific Equity Fund<br />
Inventario de la Cartera a 31 de diciembre de 2005<br />
Valores mobiliarios admitidos a cotización<br />
en una bolsa oficial o negociados en otro mercado regulado<br />
Número Descripción Valor (US$) %<br />
ACCIONES ORDINARIAS<br />
Australia<br />
77.400 Billabong International 823.815 0,33<br />
128.800 Brambles Industries* 955.472 0,39<br />
52.000 Macquarie Bank 2.597.713 1,06<br />
489.900 Macquarie Capital Alliance Group 595.227 0,24<br />
35.000 Wesfarmers<br />
____________<br />
948.505<br />
______<br />
0,39<br />
____________<br />
5.920.732<br />
______<br />
2,41<br />
Bermudas<br />
2.653.000 COFCO International 1.180.358 0,48<br />
150.000 Esprit Holdings<br />
____________<br />
1.065.860<br />
______<br />
0,44<br />
____________<br />
2.246.218<br />
______<br />
0,92<br />
Islas Caimán<br />
2.684.000 Chaoda Modern Agriculture (Holdings)<br />
____________<br />
1.116.271<br />
______<br />
0,45<br />
China<br />
865.000 China Shenhua Energy ‘H’ 953.761 0,39<br />
6.132.000 Dongfeng Motor Group ‘H’ 1.542.035 0,63<br />
389.000 Ping An Insurance Group Company<br />
of China ‘H’<br />
____________<br />
717.370<br />
______<br />
0,29<br />
____________<br />
3.213.166<br />
______<br />
1,31<br />
Hong Kong<br />
9.784.000 Denway Motors 3.249.010 1,33<br />
276.546 Hutchison Whampoa 2.633.754 1,07<br />
716.000 Wharf Holdings<br />
____________<br />
2.530.003<br />
______<br />
1,03<br />
____________<br />
8.412.767<br />
______<br />
3,43<br />
India<br />
550.000 Infrastructure Development Finance 893.583 0,36<br />
200.000 NTPC 497.515 0,20<br />
60.000 Oil & Natural Gas 1.564.839 0,64<br />
271.800 Reliance Industries<br />
____________<br />
5.368.532<br />
______<br />
2,19<br />
____________<br />
8.324.469<br />
______<br />
3,39<br />
Japón<br />
609.800 Aioi Insurance 4.252.441 1,73<br />
331.000 Asahi Glass 4.287.113 1,75<br />
540.000 Asahi Kasei 3.664.660 1,49<br />
413.000 Calsonic Kansei 2.760.639 1,13<br />
48.800 Canon 2.863.558 1,17<br />
40.000 Chiyoda Integre 1.003.504 0,41<br />
131.900 Chubu Electric Power 3.152.013 1,28<br />
206.000 Chugai Pharmaceutical 4.432.255 1,81<br />
189.200 Daikin Industries 5.551.077 2,26<br />
95.000 Exedy 2.666.089 1,09<br />
34.700 Fuji Soft ABC 1.165.638 0,48<br />
126.900 Futaba Industrial 3.054.113 1,25<br />
153.000 Hisaka Works 2.673.870 1,09<br />
220.000 Hitachi Transport System 2.263.836 0,92<br />
50.000 Honda Motor 2.861.687 1,17<br />
120.000 Hoya 4.326.972 1,76<br />
487 INPEX 4.348.658 1,77<br />
190.000 JGC 3.627.496 1,48<br />
567.000 Kubota 4.778.523 1,95<br />
456.000 Matsuzakaya* 4.265.741 1,74<br />
Valores mobiliarios admitidos a cotización<br />
en una bolsa oficial o negociados en otro mercado regulado<br />
Número Descripción Valor (US$) %<br />
363 Millea Holdings 6.266.710 2,55<br />
317.400 Mitsubishi 7.045.056 2,87<br />
848.000 Mitsubishi Rayon 5.625.063 2,29<br />
579.000 Mitsui Sumitomo Insurance 7.105.292 2,90<br />
86.000 Miura 2.106.337 0,86<br />
456 Mizuho Financial Group 3.629.758 1,48<br />
60.400 Murata Manufacturing 3.883.253 1,58<br />
731.000 Okumura 4.121.620 1,68<br />
1.563 Resona Holdings 6.313.782 2,57<br />
47.300 Rinnai 1.124.294 0,46<br />
14.100 Rohm 1.538.448 0,63<br />
83.800 Seven & I Holdings 3.598.922 1,47<br />
192.000 Shibaura Mechatronics 2.235.330 0,91<br />
158.550 Shin-Etsu Chemical 8.454.165 3,45<br />
394.200 Shinsei Bank 2.286.325 0,93<br />
742.900 Sumitomo Chemical 5.117.435 2,09<br />
445 Sumitomo Mitsui Financial Group 4.730.500 1,93<br />
215.000 Suzuki Motor 3.995.093 1,63<br />
261.000 Tadano 2.363.889 0,96<br />
178.800 Takeda Pharmaceutical 9.701.194 3,95<br />
162.900 Terumo 4.834.856 1,97<br />
9.000 Toho Titanium 937.596 0,38<br />
1.183.000 Tokyo Gas 5.271.728 2,15<br />
183.600 Toyota Industries 6.620.267 2,70<br />
40.000 Trend Micro 1.517.162 0,62<br />
1.695.000 Ube Industries/Japan<br />
____________<br />
4.612.716<br />
______<br />
1,88<br />
____________<br />
183.036.674<br />
______<br />
74,62<br />
Malasia<br />
600.000 Bumiputra-Commerce Holdings<br />
____________<br />
904.714<br />
______<br />
0,37<br />
Singapur<br />
495.000 Keppel 3.273.219 1,33<br />
182.000 Oversea-Chinese Banking 733.033 0,30<br />
720.000 SIA Engineering<br />
____________<br />
1.177.277<br />
______<br />
0,48<br />
____________<br />
5.183.529<br />
______<br />
2,11<br />
Corea del Sur<br />
40.900 Cheil Industries 1.135.999 0,46<br />
120.000 Halla Climate Control 1.458.931 0,60<br />
68.200 Hanwha Chemical 778.600 0,32<br />
14.600 Hyundai Motor 1.404.151 0,57<br />
6.800 POSCO<br />
____________<br />
1.357.714<br />
______<br />
0,55<br />
____________<br />
6.135.395<br />
______<br />
2,50<br />
Taiwan<br />
84.590 China Steel ‘144A’ GDR 1.295.732 0,53<br />
345.302 Delta Electronics<br />
____________<br />
707.963<br />
______<br />
0,29<br />
____________<br />
2.003.695<br />
______<br />
0,82<br />
Reino Unido<br />
5.036.573 Guinness Peat Group<br />
(New Zealand Listing)<br />
____________<br />
7.239.427<br />
______<br />
2,95<br />
Total cartera de valores 233.737.057 95,28<br />
Otros activos netos<br />
____________<br />
11.568.861<br />
______<br />
4,72<br />
Patrimonio neto total (US$)<br />
____________<br />
245.305.918 100,00<br />
______<br />
(*) Valores cedidos en préstamo; consúltese la nota 13 para más información.<br />
La Memoria incluida en las páginas 180 a 187 forma parte integrante de estas cuentas <strong>anual</strong>es.<br />
<strong>Informe</strong> Anual Auditado 121