Informe anual (pdf) - Cajastur
Informe anual (pdf) - Cajastur
Informe anual (pdf) - Cajastur

Create successful ePaper yourself
Turn your PDF publications into a flip-book with our unique Google optimized e-Paper software.
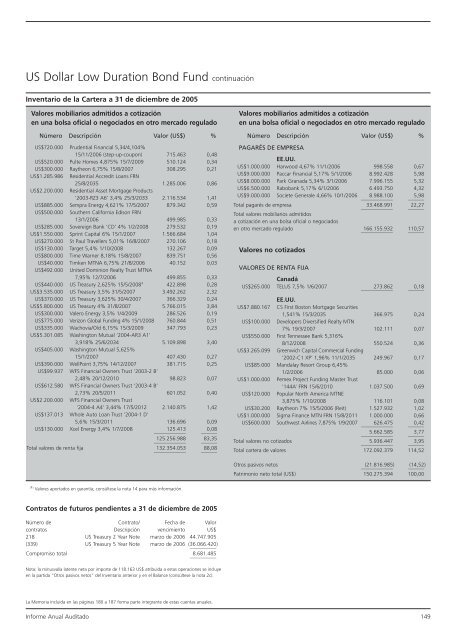
US Dollar Low Duration Bond Fund continuación<br />
Inventario de la Cartera a 31 de diciembre de 2005<br />
Valores mobiliarios admitidos a cotización<br />
en una bolsa oficial o negociados en otro mercado regulado<br />
Número Descripción Valor (US$) %<br />
US$720.000 Prudential Financial 5,34/4,104%<br />
15/11/2006 (step-up-coupon) 715.463 0,48<br />
US$520.000 Pulte Homes 4,875% 15/7/2009 510.124 0,34<br />
US$300.000 Raytheon 6,75% 15/8/2007 308.295 0,21<br />
US$1.285.986 Residential Accredit Loans FRN<br />
25/8/2035 1.285.006 0,86<br />
US$2.200.000 Residential Asset Mortgage Products<br />
‘2003-RZ3 A6’ 3,4% 25/3/2033 2.116.534 1,41<br />
US$885.000 Sempra Energy 4,621% 17/5/2007 879.342 0,59<br />
US$500.000 Southern California Edison FRN<br />
13/1/2006 499.985 0,33<br />
US$285.000 Sovereign Bank ‘CD’ 4% 1/2/2008 279.532 0,19<br />
US$1.550.000 Sprint Capital 6% 15/1/2007 1.566.684 1,04<br />
US$270.000 St Paul Travellers 5,01% 16/8/2007 270.106 0,18<br />
US$130.000 Target 5,4% 1/10/2008 132.267 0,09<br />
US$800.000 Time Warner 8,18% 15/8/2007 839.751 0,56<br />
US$40.000 Timken MTNA 6,75% 21/8/2006 40.152 0,03<br />
US$492.000 United Dominion Realty Trust MTNA<br />
7,95% 12/7/2006 499.855 0,33<br />
US$440.000 US Treasury 2,625% 15/5/2008 ‡ 422.898 0,28<br />
US$3.535.000 US Treasury 3,5% 31/5/2007 3.492.262 2,32<br />
US$370.000 US Treasury 3,625% 30/4/2007 366.329 0,24<br />
US$5.800.000 US Treasury 4% 31/8/2007 5.766.015 3,84<br />
US$300.000 Valero Energy 3,5% 1/4/2009 286.526 0,19<br />
US$775.000 Verizon Global Funding 4% 15/1/2008 760.844 0,51<br />
US$335.000 Wachovia/Old 6,15% 15/3/2009 347.793 0,23<br />
US$5.301.085 Washington Mutual ‘2004-AR3 A1’<br />
3,918% 25/6/2034 5.109.898 3,40<br />
US$405.000 Washington Mutual 5,625%<br />
15/1/2007 407.430 0,27<br />
US$390.000 WellPoint 3,75% 14/12/2007 381.715 0,25<br />
US$99.937 WFS Financial Owners Trust ‘2003-2 B’<br />
2,48% 20/12/2010 98.823 0,07<br />
US$612.580 WFS Financial Owners Trust ‘2003-4 B’<br />
2,73% 20/5/2011 601.052 0,40<br />
US$2.200.000 WFS Financial Owners Trust<br />
‘2004-4 A4’ 3,44% 17/5/2012 2.140.875 1,42<br />
US$137.013 Whole Auto Loan Trust ‘2004-1 D’<br />
5,6% 15/3/2011 136.696 0,09<br />
US$130.000 Xcel Energy 3,4% 1/7/2008<br />
____________<br />
125.413<br />
______<br />
0,08<br />
____________<br />
125.256.988<br />
______<br />
83,35<br />
Total valores de renta fija<br />
____________<br />
132.354.053<br />
______<br />
88,08<br />
Valores mobiliarios admitidos a cotización<br />
en una bolsa oficial o negociados en otro mercado regulado<br />
Número Descripción Valor (US$) %<br />
PAGARÉS DE EMPRESA<br />
EE.UU.<br />
US$1.000.000 Harwood 4,67% 11/1/2006 998.558 0,67<br />
US$9.000.000 Paccar Financial 5,17% 5/1/2006 8.992.428 5,98<br />
US$8.000.000 Park Granada 5,34% 3/1/2006 7.996.155 5,32<br />
US$6.500.000 Rabobank 5,17% 6/1/2006 6.493.750 4,32<br />
US$9.000.000 Societe Generale 4,66% 10/1/2006<br />
____________<br />
8.988.100<br />
______<br />
5,98<br />
Total pagarés de empresa ____________<br />
33.468.991 ______ 22,27<br />
Total valores mobiliarios admitidos<br />
a cotización en una bolsa oficial o negociados<br />
en otro mercado regulado ____________<br />
166.155.932 110,57 ______<br />
Valores no cotizados<br />
VALORES DE RENTA FIJA<br />
Canadá<br />
US$265.000 TELUS 7,5% 1/6/2007 ____________ 273.862 ______ 0,18<br />
EE.UU.<br />
US$7.880.167 CS First Boston Mortgage Securities<br />
1,541% 15/3/2035 366.975 0,24<br />
US$100.000 Developers Diversified Realty MTN<br />
7% 19/3/2007 102.111 0,07<br />
US$550.000 First Tennessee Bank 5,316%<br />
8/12/2008 550.524 0,36<br />
US$3.265.099 Greenwich Capital Commercial Funding<br />
‘2002-C1 XP’ 1,96% 11/1/2035 249.967 0,17<br />
US$85.000 Mandalay Resort Group 6,45%<br />
1/2/2006 85.000 0,06<br />
US$1.000.000 Pemex Project Funding Master Trust<br />
‘144A’ FRN 15/6/2010 1.037.500 0,69<br />
US$120.000 Popular North America MTNE<br />
3,875% 1/10/2008 116.101 0,08<br />
US$30.200 Raytheon 7% 15/5/2006 (Reit) 1.527.932 1,02<br />
US$1.000.000 Sigma Finance MTN FRN 15/8/2011 1.000.000 0,66<br />
US$600.000 Southwest Airlines 7,875% 1/9/2007 ____________ 626.475 ______ 0,42<br />
____________ 5.662.585 ______ 3,77<br />
Total valores no cotizados ____________ 5.936.447 ______ 3,95<br />
Total cartera de valores 172.092.379 114,52<br />
Otros pasivos netos ____________<br />
(21.816.985) ______ (14,52)<br />
Patrimonio neto total (US$) 150.275.394 100,00<br />
(‡) Valores aportados en garantía; consúltese la nota 14 para más información.<br />
Contratos de futuros pendientes a 31 de diciembre de 2005<br />
Número de<br />
Contrato/ Fecha de Valor<br />
contratos<br />
Descripción vencimiento US$<br />
218 US Treasury 2 Year Note marzo de 2006 44.747.905<br />
(339) US Treasury 5 Year Note marzo de 2006 (36.066.420)<br />
__________<br />
Compromiso total<br />
__________<br />
8.681.485<br />
Nota: la minusvalía latente neta por importe de 118.163 US$ atribuida a estas operaciones se incluye<br />
en la partida “Otros pasivos netos” del Inventario anterior y en el Balance (consúltese la nota 2c).<br />
La Memoria incluida en las páginas 180 a 187 forma parte integrante de estas cuentas <strong>anual</strong>es.<br />
<strong>Informe</strong> Anual Auditado 149