- Page 2 and 3:
AFRICANWATERDEVELOPMENTREPORT2006
- Page 4 and 5:
CONTENTSWater for Sustainable Socio
- Page 6 and 7:
ACKNOWLEDGEMENTSThis is the final v
- Page 8 and 9:
The African Water Development Repor
- Page 10 and 11:
INTRODUCTION - WATER FOR SUSTAINABL
- Page 12:
WATER FORSUSTAINABLESOCIO-ECONOMICD
- Page 15 and 16:
African Water Development Report 20
- Page 17 and 18:
African Water Development Report 20
- Page 19 and 20:
African Water Development Report 20
- Page 21 and 22: African Water Development Report 20
- Page 23 and 24: African Water Development Report 20
- Page 25 and 26: African Water Development Report 20
- Page 27 and 28: African Water Development Report 20
- Page 29 and 30: African Water Development Report 20
- Page 31 and 32: African Water Development Report 20
- Page 33 and 34: African Water Development Report 20
- Page 36: INTERNATIONALAND AFRICANMILESTONESN
- Page 39 and 40: African Water Development Report 20
- Page 41 and 42: African Water Development Report 20
- Page 44 and 45: INDICATORS -MEASURING THEPROGRESS O
- Page 46 and 47: (i) Specific for a certain stress o
- Page 48 and 49: Water and ecosystemWater and indust
- Page 50 and 51: Purpose: Global water security prov
- Page 52 and 53: Table 5.1: Adopted targets and indi
- Page 54 and 55: Human Development Index (HDI): This
- Page 56 and 57: The Environmental Sustainability In
- Page 58 and 59: Significant Indicators - Libya1. Li
- Page 60 and 61: ReferencesAfrica Facts: http://www.
- Page 62 and 63: FRESHWATERRESOURCES INAFRICAThe mai
- Page 64 and 65: annual flows of rivers and groundwa
- Page 66 and 67: Fig. 4.3: Actual Renewable Water in
- Page 68 and 69: Box 4.1: Water Availability and Ser
- Page 70 and 71: Table 4.9: Surface Water by Watersh
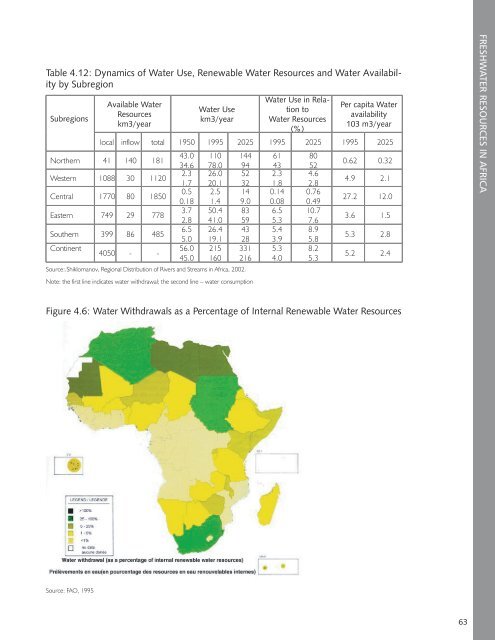
- Page 74 and 75: Figure 4.7: Major Groundwater Withd
- Page 76 and 77: Annual freshwater withdrawals in Ea
- Page 78 and 79: Fig. 4.12: Percentage of Domestic,
- Page 80 and 81: Table 4.15: Desalination capacities
- Page 82 and 83: Although some African countries hav
- Page 84 and 85: Fig. 4.17: Water Poverty Index by S
- Page 86 and 87: The problem of wastewater disposal
- Page 88 and 89: FRESHWATER RESOURCES IN AFRICASourc
- Page 90: Water Conference, December 3-7, 200
- Page 93 and 94: African Water Development Report 20
- Page 95 and 96: African Water Development Report 20
- Page 97 and 98: African Water Development Report 20
- Page 99 and 100: African Water Development Report 20
- Page 101 and 102: African Water Development Report 20
- Page 103 and 104: African Water Development Report 20
- Page 105 and 106: African Water Development Report 20
- Page 107 and 108: African Water Development Report 20
- Page 109 and 110: African Water Development Report 20
- Page 111 and 112: African Water Development Report 20
- Page 113 and 114: African Water Development Report 20
- Page 115 and 116: African Water Development Report 20
- Page 117 and 118: African Water Development Report 20
- Page 119 and 120: African Water Development Report 20
- Page 121 and 122: African Water Development Report 20
- Page 123 and 124:
African Water Development Report 20
- Page 125 and 126:
African Water Development Report 20
- Page 127 and 128:
African Water Development Report 20
- Page 129 and 130:
African Water Development Report 20
- Page 131 and 132:
African Water Development Report 20
- Page 134 and 135:
PROTECTINGECOSYSTEMSIN AFRICAThe pr
- Page 136 and 137:
abstracted and flow regulated. Irri
- Page 138 and 139:
Fig. 6.2: Freshwater Ecosystem Area
- Page 140 and 141:
Figure 6.3: Water Availability and
- Page 142 and 143:
Table 6.4: Indication of the Microb
- Page 144 and 145:
Fertilisers are also a potential th
- Page 146 and 147:
Box 6.2Pollution Control - The Ethi
- Page 148 and 149:
Fig. 6.2: Freshwater Ecosystem Area
- Page 150 and 151:
Region/Country Mammals Birds Flower
- Page 152 and 153:
espective of the fact that some oth
- Page 154 and 155:
Protected areas in Africa occupy sl
- Page 156 and 157:
past few decades, population densit
- Page 158 and 159:
Fig. 6.12: Urban Ecosystem and Buil
- Page 160 and 161:
Fig. 6.13 Environmental Sustainabil
- Page 162 and 163:
Case Study: Sediment Control andAqu
- Page 164 and 165:
Fig 6.15: Comparison of Rainfall, D
- Page 166 and 167:
South Africa and Bophuthatswana. (D
- Page 168 and 169:
of interdependent factors which adv
- Page 170 and 171:
Referencesafrol News, 2001: Lake Ch
- Page 172:
United Nations Population Divison (
- Page 175 and 176:
African Water Development Report 20
- Page 177 and 178:
African Water Development Report 20
- Page 179 and 180:
African Water Development Report 20
- Page 181 and 182:
African Water Development Report 20
- Page 183 and 184:
African Water Development Report 20
- Page 185 and 186:
African Water Development Report 20
- Page 187 and 188:
African Water Development Report 20
- Page 189 and 190:
African Water Development Report 20
- Page 191 and 192:
African Water Development Report 20
- Page 193 and 194:
African Water Development Report 20
- Page 195 and 196:
African Water Development Report 20
- Page 197 and 198:
African Water Development Report 20
- Page 199 and 200:
African Water Development Report 20
- Page 201 and 202:
African Water Development Report 20
- Page 203 and 204:
African Water Development Report 20
- Page 205 and 206:
African Water Development Report 20
- Page 207 and 208:
African Water Development Report 20
- Page 209 and 210:
African Water Development Report 20
- Page 211 and 212:
African Water Development Report 20
- Page 213 and 214:
African Water Development Report 20
- Page 215 and 216:
African Water Development Report 20
- Page 217 and 218:
African Water Development Report 20
- Page 219 and 220:
African Water Development Report 20
- Page 221 and 222:
African Water Development Report 20
- Page 223 and 224:
African Water Development Report 20
- Page 225 and 226:
African Water Development Report 20
- Page 227 and 228:
African Water Development Report 20
- Page 229 and 230:
African Water Development Report 20
- Page 231 and 232:
African Water Development Report 20
- Page 233 and 234:
African Water Development Report 20
- Page 235 and 236:
African Water Development Report 20
- Page 237 and 238:
African Water Development Report 20
- Page 239 and 240:
African Water Development Report 20
- Page 241 and 242:
African Water Development Report 20
- Page 243 and 244:
African Water Development Report 20
- Page 245 and 246:
African Water Development Report 20
- Page 247 and 248:
African Water Development Report 20
- Page 249 and 250:
African Water Development Report 20
- Page 251 and 252:
African Water Development Report 20
- Page 253 and 254:
African Water Development Report 20
- Page 255 and 256:
African Water Development Report 20
- Page 257 and 258:
African Water Development Report 20
- Page 259 and 260:
African Water Development Report 20
- Page 262 and 263:
SHARING WATERFOR REGIONALINTEGRATIO
- Page 264 and 265:
Table 11.1: Some Major Transboundar
- Page 266 and 267:
Table 11.3: Types of Management Ins
- Page 268 and 269:
Box 11.3Emerging Principles Underly
- Page 270 and 271:
the 1950s severely disrupted tradit
- Page 272 and 273:
1000 to 2000 cubic meters (m3) per
- Page 274 and 275:
countries in the southern portion o
- Page 276 and 277:
to manage water resources among rip
- Page 278 and 279:
non-payment of financial dues. Some
- Page 280 and 281:
Table 11.5: Some Basic Features of
- Page 282:
Water Resources Management In Afric
- Page 285 and 286:
African Water Development Report 20
- Page 287 and 288:
African Water Development Report 20
- Page 289 and 290:
African Water Development Report 20
- Page 291 and 292:
African Water Development Report 20
- Page 293 and 294:
African Water Development Report 20
- Page 295 and 296:
African Water Development Report 20
- Page 297 and 298:
African Water Development Report 20
- Page 299 and 300:
African Water Development Report 20
- Page 301 and 302:
African Water Development Report 20
- Page 303 and 304:
African Water Development Report 20
- Page 305 and 306:
African Water Development Report 20
- Page 308 and 309:
ENSURING THEKNOWLEDGE BASESince anc
- Page 310 and 311:
polluted due to overgrazing, and ce
- Page 312 and 313:
Box 16.2: Indigenous Knowledge on C
- Page 314 and 315:
The present day call for integrated
- Page 316 and 317:
cipitation monitoring; determinatio
- Page 318 and 319:
processes and situations or to an o
- Page 320 and 321:
Capacity Building in AfricaFrom the
- Page 322 and 323:
The requisite enabling environment
- Page 324 and 325:
African countries can obviously not
- Page 326 and 327:
the science and technology of the s
- Page 328 and 329:
Box 16.9: Research Institutions in
- Page 330 and 331:
Global Water Partnership ToolboxThe
- Page 332 and 333:
(a) Journal of Hydraulic Research:
- Page 334 and 335:
Key Outputs: The first steps for th
- Page 336 and 337:
Figure 16.6: Number of Radios per 1
- Page 338 and 339:
particular relevance to data collec
- Page 340 and 341:
of water in agriculture through imp
- Page 342 and 343:
The UNESCO Water Portal is intended
- Page 344 and 345:
IWRM Course Participants according
- Page 346 and 347:
5.. Alemayehu Tafesse (Ethiopia), 2
- Page 348:
GLOWA info gsf website: http://www.
- Page 351 and 352:
African Water Development Report 20
- Page 353 and 354:
African Water Development Report 20
- Page 355 and 356:
African Water Development Report 20
- Page 357 and 358:
African Water Development Report 20
- Page 359 and 360:
African Water Development Report 20
- Page 361 and 362:
African Water Development Report 20
- Page 363 and 364:
African Water Development Report 20
- Page 365 and 366:
African Water Development Report 20
- Page 368 and 369:
IMPLEMENTATIONOF TARGETS UNDERTHE A
- Page 370 and 371:
Public Participation;(d) Informatio
- Page 372 and 373:
a regional framework for Africa as
- Page 374:
Programme SubRegion Estimated Costs
- Page 377 and 378:
African Water Development Report 20
- Page 379:
African Water Development Report 20


