rivista italiana di economia demografia e statistica - Sieds
rivista italiana di economia demografia e statistica - Sieds
rivista italiana di economia demografia e statistica - Sieds

You also want an ePaper? Increase the reach of your titles
YUMPU automatically turns print PDFs into web optimized ePapers that Google loves.
200<br />
Volume LXIII nn. 3-4 – Luglio-Dicembre 2009<br />
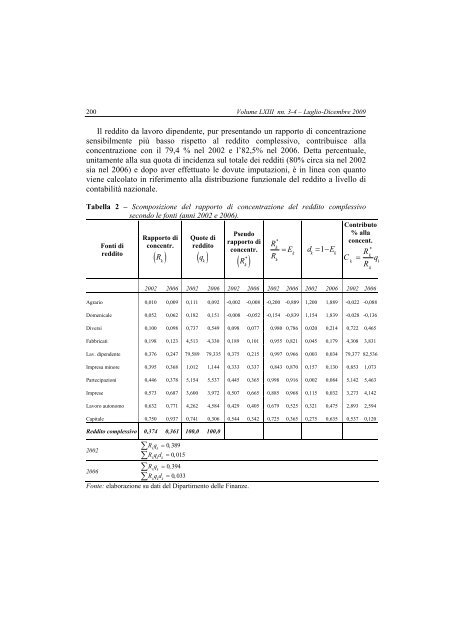
Il red<strong>di</strong>to da lavoro <strong>di</strong>pendente, pur presentando un rapporto <strong>di</strong> concentrazione<br />
sensibilmente più basso rispetto al red<strong>di</strong>to complessivo, contribuisce alla<br />
concentrazione con il 79,4 % nel 2002 e l’82,5% nel 2006. Detta percentuale,<br />
unitamente alla sua quota <strong>di</strong> incidenza sul totale dei red<strong>di</strong>ti (80% circa sia nel 2002<br />
sia nel 2006) e dopo aver effettuato le dovute imputazioni, è in linea con quanto<br />
viene calcolato in riferimento alla <strong>di</strong>stribuzione funzionale del red<strong>di</strong>to a livello <strong>di</strong><br />
contabilità nazionale.<br />
Tabella 2 – Scomposizione del rapporto <strong>di</strong> concentrazione del red<strong>di</strong>to complessivo<br />
secondo le fonti (anni 2002 e 2006).<br />
Fonti <strong>di</strong><br />
red<strong>di</strong>to<br />
Rapporto <strong>di</strong><br />
concentr.<br />
( R<br />
k )<br />
Quote <strong>di</strong><br />
red<strong>di</strong>to<br />
( q<br />
k )<br />
Pseudo<br />
rapporto <strong>di</strong><br />
concentr.<br />
*<br />
Rk<br />
= E<br />
R<br />
R * k<br />
( k )<br />
k<br />
d = 1−<br />
E<br />
k<br />
k<br />
Contributo<br />
% alla<br />
concent.<br />
*<br />
Rk<br />
C = q<br />
k<br />
R<br />
k<br />
k<br />
2002 2006 2002 2006 2002 2006 2002 2006 2002 2006 2002 2006<br />
Agrario 0,010 0,009 0,111 0,092 -0,002 -0,008 -0,200 -0,889 1,200 1,889 -0,022 -0,088<br />
Domenicale 0,052 0,062 0,182 0,151 -0,008 -0,052 -0,154 -0,839 1,154 1,839 -0,028 -0,136<br />
Diversi 0,100 0,098 0,737 0,549 0,098 0,077 0,980 0,786 0,020 0,214 0,722 0,465<br />
Fabbricati 0,198 0,123 4,513 4,330 0,189 0,101 0,955 0,821 0,045 0,179 4,308 3,831<br />
Lav. <strong>di</strong>pendente 0,376 0,247 79,589 79,335 0,375 0,215 0,997 0,966 0,003 0,034 79,377 82,536<br />
Impresa minore 0,395 0,368 1,012 1,144 0,333 0,337 0,843 0,870 0,157 0,130 0,853 1,073<br />
Partecipazioni 0,446 0,378 5,154 5,537 0,445 0,365 0,998 0,916 0,002 0,084 5,142 5,463<br />
Imprese 0,573 0,687 3,600 3,972 0,507 0,665 0,885 0,968 0,115 0,032 3,273 4,142<br />
Lavoro autonomo 0,632 0,771 4,262 4,584 0,429 0,405 0,679 0,525 0,321 0,475 2,893 2,594<br />
Capitale 0,750 0,937 0,741 0,306 0,544 0,342 0,725 0,365 0,275 0,635 0,537 0,120<br />
Red<strong>di</strong>to complessivo 0,374 0,361 100,0 100,0<br />
2002<br />
2006<br />
∑<br />
Rq = 0,<br />
389<br />
∑ k k<br />
Rqd<br />
k k k<br />
∑<br />
∑ k k<br />
Rqd<br />
k k k<br />
= 0,<br />
015<br />
Rq = 0394 ,<br />
= 0033 ,<br />
Fonte: elaborazione su dati del Dipartimento delle Finanze.