rivista italiana di economia demografia e statistica - Sieds
rivista italiana di economia demografia e statistica - Sieds
rivista italiana di economia demografia e statistica - Sieds

Create successful ePaper yourself
Turn your PDF publications into a flip-book with our unique Google optimized e-Paper software.
36<br />
Volume LXIII nn. 3-4 – Luglio-Dicembre 2009<br />
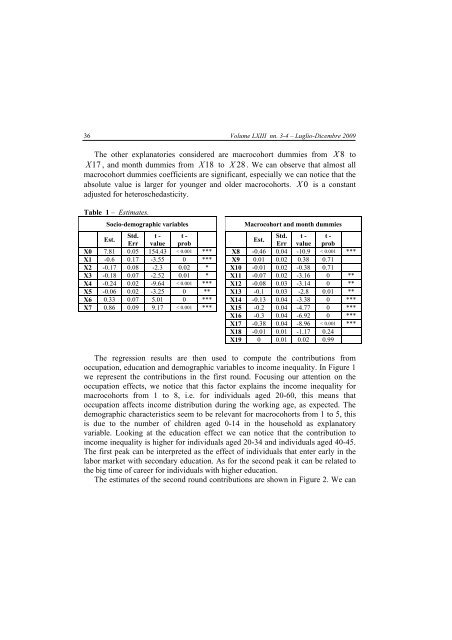
The other explanatories considered are macrocohort dummies from X 8 to<br />
X 17 , and month dummies from X 18 to X 28 . We can observe that almost all<br />
macrocohort dummies coefficients are significant, especially we can notice that the<br />
absolute value is larger for younger and older macrocohorts. X 0 is a constant<br />
adjusted for heteroschedasticity.<br />
Table 1 – Estimates.<br />
Socio-demographic variables<br />
Macrocohort and month dummies<br />
Est.<br />
Std. t - t -<br />
Std. t - t -<br />
Est.<br />
Err value prob<br />
Err value prob<br />
X0 7.81 0.05 154.43 < 0.001 *** X8 -0.46 0.04 -10.9 < 0.001 ***<br />
X1 -0.6 0.17 -3.55 0 *** X9 0.01 0.02 0.38 0.71<br />
X2 -0.17 0.08 -2.3 0.02 * X10 -0.01 0.02 -0.38 0.71<br />
X3 -0.18 0.07 -2.52 0.01 * X11 -0.07 0.02 -3.16 0 **<br />
X4 -0.24 0.02 -9.64 < 0.001 *** X12 -0.08 0.03 -3.14 0 **<br />
X5 -0.06 0.02 -3.25 0 ** X13 -0.1 0.03 -2.8 0.01 **<br />
X6 0.33 0.07 5.01 0 *** X14 -0.13 0.04 -3.38 0 ***<br />
X7 0.86 0.09 9.17 < 0.001 *** X15 -0.2 0.04 -4.77 0 ***<br />
X16 -0.3 0.04 -6.92 0 ***<br />
X17 -0.38 0.04 -8.96 < 0.001 ***<br />
X18 -0.01 0.01 -1.17 0.24<br />
X19 0 0.01 0.02 0.99<br />
The regression results are then used to compute the contributions from<br />
occupation, education and demographic variables to income inequality. In Figure 1<br />
we represent the contributions in the first round. Focusing our attention on the<br />
occupation effects, we notice that this factor explains the income inequality for<br />
macrocohorts from 1 to 8, i.e. for in<strong>di</strong>viduals aged 20-60, this means that<br />
occupation affects income <strong>di</strong>stribution during the working age, as expected. The<br />
demographic characteristics seem to be relevant for macrocohorts from 1 to 5, this<br />
is due to the number of children aged 0-14 in the household as explanatory<br />
variable. Looking at the education effect we can notice that the contribution to<br />
income inequality is higher for in<strong>di</strong>viduals aged 20-34 and in<strong>di</strong>viduals aged 40-45.<br />
The first peak can be interpreted as the effect of in<strong>di</strong>viduals that enter early in the<br />
labor market with secondary education. As for the second peak it can be related to<br />
the big time of career for in<strong>di</strong>viduals with higher education.<br />
The estimates of the second round contributions are shown in Figure 2. We can