- Page 1:
MaxSea Operator Manual version 12.6
- Page 4 and 5:
MaxSea Operator Manual version 12.6
- Page 6 and 7:
MaxSea Operator Manual version 12.6
- Page 8 and 9:
MaxSea Operator Manual version 12.6
- Page 10 and 11:
MaxSea Operator Manual version 12.6
- Page 12:
MaxSea Operator Manual version 12.6
- Page 15 and 16:
USER GUIDE: MaxSea New Faetures 3
- Page 17 and 18:
User Interface Looking at the Chart
- Page 19 and 20:
Toolbar Cursor Data User Interface
- Page 21 and 22:
Notes: (1) - there is a display for
- Page 23 and 24:
User Interface 2. To return to the
- Page 25 and 26:
Bearing tool The Bearing tool is a
- Page 27 and 28:
Select tool (Finger symbol) Lasso R
- Page 29 and 30:
Plotting Drawing Type User Interfac
- Page 31 and 32:
NavNet system MaxSea-NavNet Overvie
- Page 33 and 34:
Legend (1) - GPS Antenna (2) - Rada
- Page 35 and 36:
WARNING : NavNet system You have to
- Page 37 and 38:
GPS on the chart Your GPS on the ch
- Page 39 and 40:
2. Click the Misc tab for calling u
- Page 41 and 42:
How to enable the Auto-Scale functi
- Page 43 and 44:
GPS on the chart • Enter directly
- Page 45:
GPS on the chart 1 - Click on the M
- Page 48 and 49:
MaxSea Operator Manual version 12.6
- Page 50 and 51:
MaxSea Operator Manual version 12.6
- Page 52 and 53:
MaxSea Operator Manual version 12.6
- Page 54 and 55:
MaxSea Operator Manual version 12.6
- Page 57 and 58:
Routes Routes overview A Route is a
- Page 59 and 60:
(1) Route using QuickWaypoints, (2)
- Page 61 and 62:
Routes Center All your Routes are d
- Page 63 and 64:
Name To assign a own name of a rout
- Page 65 and 66:
Fig. 1 shows you the selected Leg o
- Page 67 and 68:
SOG SOW Speed Over Ground - it is t
- Page 69 and 70:
XTE Cross Track Error - The distanc
- Page 71 and 72:
Add Waypoints to a Route Additional
- Page 73 and 74:
Reverse the Selected Route Routes W
- Page 75 and 76:
more information, refer to the rela
- Page 77 and 78:
Waypoints Waypoints Overview Waypoi
- Page 79 and 80:
access and modify the properties of
- Page 81 and 82:
displaying waypoint. modifiable. FI
- Page 83 and 84:
Active Route Data Transfer Device O
- Page 85 and 86:
On a selected waypoint drawn on the
- Page 87 and 88:
Active Route Note: the software aut
- Page 89 and 90:
Then choose [New Search and Rescue
- Page 91 and 92:
Data Transfer Device Data Transfer
- Page 93 and 94:
Note: Tracks (1) - According to the
- Page 95 and 96:
NS = Not Supported Data Transfer De
- Page 97 and 98:
Data Transfer Device - Rte valid na
- Page 99 and 100:
Data Transfer Device - Wpt valid na
- Page 101 and 102:
.ErrorChar : 0x\00 .EofChar : 0x\00
- Page 103 and 104:
.Parity : 0 .StopBits : 0 .XonChar
- Page 105 and 106:
.fRtsControl : 0 .fAbortOnError : 0
- Page 107 and 108:
.XonChar : 0x\11 .XoffChar : 0x\13
- Page 109 and 110:
- - - - - - - - - - - - - - - - - -
- Page 111 and 112:
- MxDemandeStatutGPS : PNTI,000 ---
- Page 113:
When GPS upload function is activat
- Page 116 and 117:
MaxSea Operator Manual version 12.6
- Page 118 and 119:
MaxSea Operator Manual version 12.6
- Page 120 and 121:
MaxSea Operator Manual version 12.6
- Page 123 and 124:
User's Data Adding personal marks U
- Page 125 and 126:
User's Data The left part of the bo
- Page 127 and 128:
Repeat the operation, changing the
- Page 129 and 130:
User's Data You can either display
- Page 131 and 132:
User's Data 3. Type in your text (6
- Page 133 and 134:
3 - to delete the mark. 4 - to sele
- Page 135 and 136:
User's Data Using the Position modi
- Page 137 and 138:
User's Data To do this, first selec
- Page 139 and 140:
6. Closing user's data layer file (
- Page 141 and 142:
Drawing layer's catalog All drawing
- Page 143 and 144:
(2) - only the layers modified sinc
- Page 145 and 146:
Note: in case of a bad version or a
- Page 147 and 148:
• The AutoCAD file has to respect
- Page 149 and 150:
User's Data Plotting and modificati
- Page 151 and 152:
Electronic Charts Electronic Charts
- Page 153 and 154:
4 - the chart is opened and display
- Page 155 and 156:
Electronic Charts IMPORTANT - Each
- Page 157 and 158:
2 - Using the "Zoom in" and "Zoom o
- Page 159 and 160:
Downstair left-hand corner window c
- Page 161 and 162:
Electronic Charts The chart is show
- Page 163 and 164:
W000 / W003 Electronic Charts IMPOR
- Page 165 and 166:
Electronic Charts Specific items ac
- Page 167 and 168:
019 Arc 1950 -- Malawi 020 Arc 1950
- Page 169 and 170:
086 Kertau 1948 -- West Malaysia &
- Page 171 and 172:
151 Provisional S. American 1956 --
- Page 173 and 174:
2 - The chart data display depends
- Page 175 and 176:
Mapmedia mm2 Charts Electronic Char
- Page 177 and 178:
Electronic Charts 3. Chart File Not
- Page 179 and 180:
Electronic Charts The chart which w
- Page 181 and 182:
Electronic Charts To obtain informa
- Page 183 and 184:
Opening a M.C. Pack Chart file Elec
- Page 185 and 186:
The Status allows the user to know
- Page 187 and 188:
Tips Electronic Charts The Chart Zo
- Page 189 and 190:
Following list shows available C-Ma
- Page 191 and 192:
Note: to order C-MAP NT/PC refer to
- Page 193 and 194:
To display an own configuration: 1.
- Page 195 and 196:
C-Map NT Chart Object Properties Yo
- Page 197 and 198:
Closing C-Map NT chart Electronic C
- Page 199 and 200:
CMAP NT CMap CM93 v3 Geographic Gri
- Page 201 and 202:
• Other in standard S52. • S52
- Page 203 and 204:
Electronic Charts The "Change Confi
- Page 205 and 206:
Electronic Charts Anchorage area (a
- Page 207 and 208:
GP_PARAM_ID_PLAIN_DEPCNT GP_PARAM_I
- Page 209 and 210:
Weather Forecast Weather overview M
- Page 211 and 212:
2. save it to your computer • Cli
- Page 213 and 214:
Weather Forecast 1. click and drag
- Page 215 and 216:
Wind feather : For wind information
- Page 217 and 218:
06 09 : 13 Jan. 18. -06 01 : 00 Sel
- Page 219 and 220:
• Second number (00s). Note : 1 h
- Page 221 and 222:
(see Register to MaxSea Chopper cha
- Page 223 and 224:
• To receive Select Subscribe to
- Page 225 and 226:
Pressure Global (with Inland) 1°x1
- Page 227 and 228:
Geopotential Height Global (with In
- Page 229 and 230:
Tides and Tidal Currents Tides and
- Page 231 and 232:
• Use the right-click menu on sel
- Page 233 and 234:
The tidal height function is used t
- Page 235 and 236:
Tides and Tidal Currents Arrows bec
- Page 237 and 238:
Tides and Tidal Currents Note for e
- Page 239 and 240:
When you choose to display this win
- Page 241 and 242:
2D Bathymetric Maps 2D Bathy Maps W
- Page 243 and 244:
IMPORTANT 2D Bathymetric Maps MaxSe
- Page 245 and 246:
IMPORTANT Display only User data 2D
- Page 247 and 248:
The configuration is simultaneously
- Page 249 and 250:
Overlaying simultaneously several t
- Page 251 and 252:
2D Bathymetric Maps Here the "isoba
- Page 253 and 254:
3D Bathymetric database 3D Bathymet
- Page 255 and 256:
3D Database Import Import data to M
- Page 257 and 258:
By choosing in the first zone area
- Page 259 and 260:
Click on "Open" and the file path w
- Page 261 and 262:
User comments [PARAMETERS] HeightUn
- Page 263 and 264:
Note: 1. To add several user data f
- Page 265 and 266:
3D Bathymetric database • Before
- Page 267 and 268:
BE CAREFUL: this operation can take
- Page 269 and 270:
How to configure the Offset Data Im
- Page 271 and 272:
Then choose a station from the harb
- Page 273 and 274:
MaxSea allows to display independen
- Page 275 and 276:
See also related topics: 1. Modify
- Page 277 and 278:
Correct value representation First
- Page 279 and 280:
After you have chosen the option se
- Page 281 and 282:
To do it select [Manage 3D database
- Page 283 and 284:
Repair the 3D database MaxSea verif
- Page 285:
Archived 3D Database What means arc
- Page 288 and 289:
MaxSea Operator Manual version 12.6
- Page 290 and 291:
MaxSea Operator Manual version 12.6
- Page 292 and 293:
MaxSea Operator Manual version 12.6
- Page 294 and 295:
MaxSea Operator Manual version 12.6
- Page 296 and 297:
MaxSea Operator Manual version 12.6
- Page 298 and 299:
MaxSea Operator Manual version 12.6
- Page 300 and 301:
MaxSea Operator Manual version 12.6
- Page 302 and 303: MaxSea Operator Manual version 12.6
- Page 304 and 305: MaxSea Operator Manual version 12.6
- Page 306 and 307: MaxSea Operator Manual version 12.6
- Page 308 and 309: MaxSea Operator Manual version 12.6
- Page 310 and 311: MaxSea Operator Manual version 12.6
- Page 312 and 313: MaxSea Operator Manual version 12.6
- Page 314 and 315: MaxSea Operator Manual version 12.6
- Page 316 and 317: MaxSea Operator Manual version 12.6
- Page 319 and 320: Trawl Positioning Dead Reckoning Tr
- Page 321 and 322: ofile Contour Depth Profile Contour
- Page 323 and 324: 2. Click on "Trawl" . 3. Select the
- Page 325 and 326: Description: 1 - DAP1 and DAP2 foll
- Page 327 and 328: dY = Horizontal distance from the t
- Page 329 and 330: Dredge Function Dredge Function Ove
- Page 331 and 332: Dredge Quality Inactive dredge (Qua
- Page 333 and 334: Sounder Depth Profile Depth Profile
- Page 335 and 336: 4 - Historic Mode • Plot "Events"
- Page 337 and 338: file NavNet (1) HF/LF axSea Mode Na
- Page 339 and 340: Shift level m (maximal value for R+
- Page 341 and 342: Sounder Depth Profile 2. You may sp
- Page 343 and 344: Fig.1 : Représentation du profil d
- Page 345 and 346: MaxSea Depth Profile User Interface
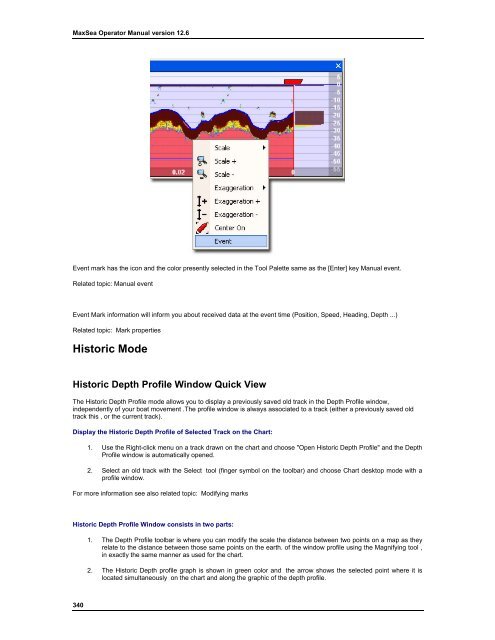
- Page 347 and 348: Scale + Scale - Exaggeration Exagge
- Page 349 and 350: Depth Profile Outline is only depen
- Page 351: ID Information (1) (2) (3) (4) Disp
- Page 355 and 356: Enter an event to plot fish schools
- Page 357 and 358: A-scope Sounder Depth Profile • C
- Page 359 and 360: Temperature Graph displayed with Na
- Page 361 and 362: Targets Targets Overview MaxSea sha
- Page 363 and 364: Targets The "Center on" function is
- Page 365 and 366: 5. Erase the selected target from t
- Page 367 and 368: Display Position at CPA: TCPA : Tim
- Page 369 and 370: Automatically Tracking Targets The
- Page 371 and 372: IMPORTANT Note : the Target Center
- Page 373 and 374: Note that this item may be disable
- Page 375 and 376: ARPA's Target Symbol To display the
- Page 377 and 378: How to configure AIS system with Ma
- Page 379 and 380: Using the Select point tool double
- Page 381 and 382: Note: the static Data are integrate
- Page 383 and 384: EXTRA IO port : outputs AIS entence
- Page 385 and 386: Input / Output of AIS signal Target
- Page 387 and 388: Buoy's Target Symbol Activating the
- Page 389 and 390: Activating the Fleet tracking To ac
- Page 391 and 392: Radar OVERLAY Radar Overlay Overvie
- Page 393 and 394: Gain Status Gain AC Sea Transmit Ma
- Page 395 and 396: AC Sea Level AC Auto On - Off AC Ra
- Page 397 and 398: Radar / Chart Offset Direction 0-36
- Page 399 and 400: may be missed. FTC % 0-100 To adjus
- Page 401 and 402: 6 minutes 12 minutes Setting Up FUR
- Page 403 and 404:
Gain AC Sea AC Rain Radar Source Me
- Page 405 and 406:
Display Option Range Operation Echo
- Page 407 and 408:
Noise Rejection Tune Auto/Manual Tu
- Page 409 and 410:
To center on the chart in the radar
- Page 411 and 412:
When the Minimum or Maximum Range i
- Page 413 and 414:
Acquiring Radar Targets Acquiring R
- Page 415:
To Free a Radar Target Radar OVERLA
- Page 418 and 419:
MaxSea Operator Manual version 12.6
- Page 420 and 421:
MaxSea Operator Manual version 12.6
- Page 422 and 423:
MaxSea Operator Manual version 12.6
- Page 424 and 425:
MaxSea Operator Manual version 12.6
- Page 426 and 427:
MaxSea Operator Manual version 12.6
- Page 428 and 429:
MaxSea Operator Manual version 12.6
- Page 430 and 431:
MaxSea Operator Manual version 12.6
- Page 432 and 433:
MaxSea Operator Manual version 12.6
- Page 434 and 435:
MaxSea Operator Manual version 12.6
- Page 436 and 437:
MaxSea Operator Manual version 12.6
- Page 438 and 439:
MaxSea Operator Manual version 12.6
- Page 440 and 441:
MaxSea Operator Manual version 12.6
- Page 442 and 443:
MaxSea Operator Manual version 12.6
- Page 444 and 445:
MaxSea Operator Manual version 12.6
- Page 446 and 447:
MaxSea Operator Manual version 12.6
- Page 448 and 449:
MaxSea Operator Manual version 12.6
- Page 450 and 451:
MaxSea Operator Manual version 12.6
- Page 453 and 454:
Professional Weather Routing What i
- Page 455 and 456:
At this moment the routing will sto
- Page 457 and 458:
Professional Weather Routing Once t
- Page 459 and 460:
Professional Weather Routing 4 - al
- Page 461 and 462:
Launch a new Route plan Refer to th
- Page 463:
Professional Weather Routing The re
- Page 466 and 467:
MaxSea Operator Manual version 12.6
- Page 468 and 469:
MaxSea Operator Manual version 12.6
- Page 470 and 471:
MaxSea Operator Manual version 12.6
- Page 472 and 473:
MaxSea Operator Manual version 12.6
- Page 474 and 475:
MaxSea Operator Manual version 12.6
- Page 476 and 477:
MaxSea Operator Manual version 12.6
- Page 478 and 479:
MaxSea Operator Manual version 12.6
- Page 480 and 481:
MaxSea Operator Manual version 12.6
- Page 482 and 483:
MaxSea Operator Manual version 12.6
- Page 484 and 485:
MaxSea Operator Manual version 12.6
- Page 486 and 487:
MaxSea Operator Manual version 12.6
- Page 488 and 489:
MaxSea Operator Manual version 12.6
- Page 490 and 491:
MaxSea Operator Manual version 12.6
- Page 492 and 493:
MaxSea Operator Manual version 12.6
- Page 494 and 495:
MaxSea Operator Manual version 12.6
- Page 496 and 497:
MaxSea Operator Manual version 12.6
- Page 498 and 499:
MaxSea Operator Manual version 12.6
- Page 500 and 501:
MaxSea Operator Manual version 12.6
- Page 502 and 503:
MaxSea Operator Manual version 12.6
- Page 504 and 505:
MaxSea Operator Manual version 12.6
- Page 506 and 507:
MaxSea Operator Manual version 12.6
- Page 508 and 509:
MaxSea Operator Manual version 12.6
- Page 510 and 511:
MaxSea Operator Manual version 12.6
- Page 512 and 513:
MaxSea Operator Manual version 12.6
- Page 514 and 515:
MaxSea Operator Manual version 12.6
- Page 517 and 518:
Glossary A ACK: Acknowledge ACQ: Ac
- Page 519 and 520:
Glossary DDE: Dynamic Data Exchange
- Page 521 and 522:
Glossary Manual activation email: I
- Page 523:
U Glossary UDP: User Datagram Proto
- Page 526 and 527:
MaxSea Operator Manual version 12.6
- Page 528 and 529:
MaxSea Operator Manual version 12.6