Zbornik radova Koridor 10 - Kirilo SaviÄ
Zbornik radova Koridor 10 - Kirilo SaviÄ
Zbornik radova Koridor 10 - Kirilo SaviÄ

Create successful ePaper yourself
Turn your PDF publications into a flip-book with our unique Google optimized e-Paper software.
3rd International Scientific and Professional Conference<br />
CORRIDOR <strong>10</strong> - a sustainable way of integrations<br />
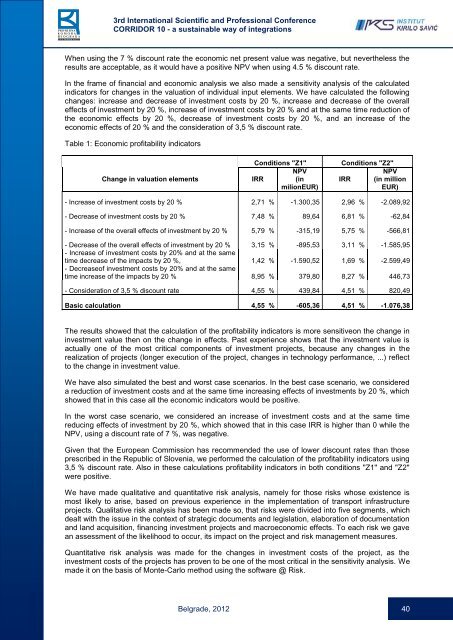
When using the 7 % discount rate the economic net present value was negative, but nevertheless the<br />
results are acceptable, as it would have a positive NPV when using 4.5 % discount rate.<br />
In the frame of financial and economic analysis we also made a sensitivity analysis of the calculated<br />
indicators for changes in the valuation of individual input elements. We have calculated the following<br />
changes: increase and decrease of investment costs by 20 %, increase and decrease of the overall<br />
effects of investment by 20 %, increase of investment costs by 20 % and at the same time reduction of<br />
the economic effects by 20 %, decrease of investment costs by 20 %, and an increase of the<br />
economic effects of 20 % and the consideration of 3,5 % discount rate.<br />
Table 1: Economic profitability indicators<br />
Change in valuation elements<br />
Conditions "Z1"<br />
NPV<br />
IRR (in<br />
milionEUR)<br />
Conditions "Z2"<br />
NPV<br />
IRR (in million<br />
EUR)<br />
- Increase of investment costs by 20 % 2,71 % -1.300,35 2,96 % -2.089,92<br />
- Decrease of investment costs by 20 % 7,48 % 89,64 6,81 % -62,84<br />
- Increase of the overall effects of investment by 20 % 5,79 % -315,19 5,75 % -566,81<br />
- Decrease of the overall effects of investment by 20 % 3,15 % -895,53 3,11 % -1.585,95<br />
- Increase of investment costs by 20% and at the same<br />
time decrease of the impacts by 20 %, 1,42 % -1.590,52 1,69 % -2.599,49<br />
- Decreaseof investment costs by 20% and at the same<br />
time increase of the impacts by 20 % 8,95 % 379,80 8,27 % 446,73<br />
- Consideration of 3,5 % discount rate 4,55 % 439,84 4,51 % 820,49<br />
Basic calculation 4,55 % -605,36 4,51 % -1.076,38<br />
The results showed that the calculation of the profitability indicators is more sensitiveon the change in<br />
investment value then on the change in effects. Past experience shows that the investment value is<br />
actually one of the most critical components of investment projects, because any changes in the<br />
realization of projects (longer execution of the project, changes in technology performance, ...) reflect<br />
to the change in investment value.<br />
We have also simulated the best and worst case scenarios. In the best case scenario, we considered<br />
a reduction of investment costs and at the same time increasing effects of investments by 20 %, which<br />
showed that in this case all the economic indicators would be positive.<br />
In the worst case scenario, we considered an increase of investment costs and at the same time<br />
reducing effects of investment by 20 %, which showed that in this case IRR is higher than 0 while the<br />
NPV, using a discount rate of 7 %, was negative.<br />
Given that the European Commission has recommended the use of lower discount rates than those<br />
prescribed in the Republic of Slovenia, we performed the calculation of the profitability indicators using<br />
3,5 % discount rate. Also in these calculations profitability indicators in both conditions "Z1" and "Z2"<br />
were positive.<br />
We have made qualitative and quantitative risk analysis, namely for those risks whose existence is<br />
most likely to arise, based on previous experience in the implementation of transport infrastructure<br />
projects. Qualitative risk analysis has been made so, that risks were divided into five segments, which<br />
dealt with the issue in the context of strategic documents and legislation, elaboration of documentation<br />
and land acquisition, financing investment projects and macroeconomic effects. To each risk we gave<br />
an assessment of the likelihood to occur, its impact on the project and risk management measures.<br />
Quantitative risk analysis was made for the changes in investment costs of the project, as the<br />
investment costs of the projects has proven to be one of the most critical in the sensitivity analysis. We<br />
made it on the basis of Monte-Carlo method using the software @ Risk.<br />
Belgrade, 2012 40