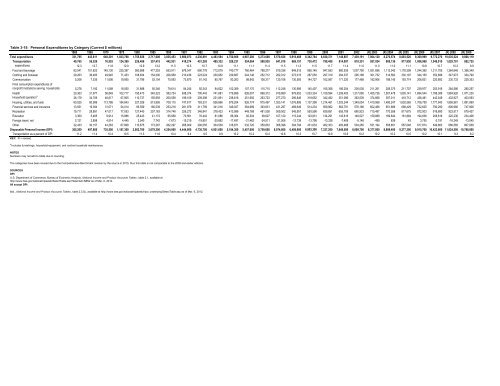
Table 3-15: Personal Expenditures by Category (Current $ millions)1960 1965 1970 1975 1980 1985 1990 1991 1992 1993 1994 1995 1996 1997 1998 1999 2000 2001 2002 (R) 2003 (R) 2004 (R) 2005 (R) 2006 (R) 2007 (R) 2008 (R) 2009Total expenditures 331,795 443,811 648,301 1,033,788 1,755,826 2,717,608 3,835,453 3,980,073 4,236,891 4,483,594 4,750,806 4,987,280 5,273,608 5,570,626 5,918,488 6,342,784 6,830,371 7,148,807 7,439,191 7,804,120 8,270,574 8,803,526 9,300,999 9,772,270 10,035,524 9,866,119<strong>Transportation</strong> as a percent <strong>of</strong> total40,765 56,529 76,503 124,390 226,486 357,415 442,931 418,274 451,285 485,332 528,231 554,064 598,935 641,818 669,157 730,472 798,408 814,097 818,351 857,024 909,136 977,950 1,006,969 1,049,915 1,029,701 882,725expenditures 12.3 12.7 11.8 12.0 12.9 13.2 11.5 10.5 10.7 10.8 11.1 11.1 11.4 11.5 11.3 11.5 11.7 11.4 11.0 11.0 11.0 11.1 10.8 10.7 10.3 8.9Food and beverage 83,041 101,623 145,130 225,387 360,888 477,253 653,911 676,347 690,778 712,079 740,777 760,464 789,277 819,336 849,515 895,149 947,583 980,935 1,007,790 1,051,696 1,112,042 1,178,399 1,244,390 1,311,705 1,364,646 1,356,349Clothing and footwear 29,263 36,483 49,945 71,433 108,834 154,300 206,959 210,436 223,024 230,952 239,687 244,146 252,712 262,012 273,015 287,050 297,319 294,337 295,168 301,732 314,560 330,197 344,150 352,696 347,973 334,790Communication 5,206 7,535 11,606 19,955 31,796 53,104 70,093 73,870 81,142 85,767 93,263 98,942 108,317 120,106 130,593 144,727 162,067 171,320 177,468 182,906 189,145 193,774 206,821 220,892 230,733 229,353Final consumption expenditures <strong>of</strong>nonpr<strong>of</strong>it institutions serving households 5,276 7,192 11,089 18,050 31,888 50,346 79,614 84,245 92,343 94,622 102,369 107,170 115,715 112,248 130,995 145,407 165,368 186,204 205,005 211,261 209,375 211,707 239,977 253,916 284,586 280,257Health 20,363 31,977 56,849 102,717 195,473 345,323 583,724 638,374 700,443 741,681 779,896 826,007 868,312 919,880 979,652 1,033,334 1,109,594 1,209,403 1,317,080 1,405,726 1,507,478 1,605,141 1,694,544 1,798,389 1,884,926 1,971,220Household operation a 26,179 34,706 46,617 67,805 110,737 155,993 200,559 199,109 209,398 221,891 238,616 251,692 263,723 277,270 296,846 319,652 342,492 351,096 363,539 374,666 397,011 418,712 436,491 442,549 432,927 403,093Housing, utilities, and fuels 60,525 80,999 113,786 184,843 327,026 513,995 709,115 747,817 783,331 826,866 879,204 926,774 975,497 1,023,141 1,076,806 1,137,399 1,214,461 1,303,244 1,349,054 1,410,568 1,480,247 1,602,565 1,706,759 1,777,943 1,856,981 1,891,890Financial services and insurance 13,551 19,394 31,071 54,014 95,599 180,539 253,218 281,979 311,759 341,016 349,027 364,689 393,631 431,297 469,649 514,234 569,962 562,791 576,166 602,466 651,686 698,429 732,625 790,290 806,980 747,808Recreation 19,711 28,891 47,017 77,053 127,440 207,163 314,746 326,272 346,841 378,423 413,996 449,768 481,538 509,502 545,957 593,596 639,851 655,708 680,923 715,487 770,558 817,675 872,003 918,690 923,517 879,427Education 3,360 5,465 9,914 15,886 25,443 41,172 65,958 70,561 76,442 81,086 86,364 92,304 99,627 107,120 115,244 123,931 134,291 143,615 149,527 159,889 169,844 181,884 194,636 208,616 222,236 234,406Foreign travel, net 2,121 2,858 4,514 4,445 3,540 7,742 -7,673 -15,219 -19,951 -20,662 -17,497 -21,462 -24,511 -21,506 -13,739 -13,798 -13,328 -7,409 -5,148 -499 639 43 3,755 -3,191 -16,249 -13,040Other 22,433 30,157 44,263 67,808 110,675 173,267 262,297 268,009 290,055 304,538 316,871 332,720 350,833 368,398 394,794 431,633 462,303 483,468 504,265 531,194 558,851 587,048 617,874 649,863 666,565 667,838Disposable Personal Income (DPI) 365,200 497,800 735,500 1,187,300 2,002,700 3,079,300 4,254,000 4,444,900 4,736,700 4,921,600 5,184,300 5,457,000 5,759,600 6,074,600 6,498,900 6,803,300 7,327,200 7,648,500 8,009,700 8,377,800 8,889,400 9,277,300 9,915,700 10,423,600 11,024,500 10,788,800<strong>Transportation</strong> as a percent <strong>of</strong> DPI 11.2 11.4 10.4 10.5 11.3 11.6 10.4 9.4 9.5 9.9 10.2 10.2 10.4 10.6 10.3 10.7 10.9 10.6 10.2 10.2 10.2 10.5 10.2 10.1 9.3 8.2KEY: R = revised.aIncludes furnishings, household equipment, and routine household maintenance.NOTESNumbers may not add to totals due to rounding.The categories have been revised due to the Comprehensive Benchmark revision by the source in 2010, thus this table is not comparable to the 2009 and earlier editions.SOURCESDPI:U.S. <strong>Department</strong> <strong>of</strong> Commerce, Bureau <strong>of</strong> Economic Analysis, National Income and Product Accounts Tables , table 2.1, available athttp://www.bea.gov/national/nipaweb/SelectTable.asp?Selected=N#S2 as <strong>of</strong> Mar. 6, 2012.All except DPI:Ibid., National Income and Product Accounts Tables , table 2.3.5u, available at http://www.bea.gov/national/nipaweb/nipa_underlying/SelectTable.asp as <strong>of</strong> Mar. 6, 2012.
Table 3-16: Personal Consumption Expenditures on <strong>Transportation</strong> by Subcategory (Current millions <strong>of</strong> dollars)1960 1965 1970 1975 1980 1985 1990 1991 1992 1993 1994 1995 1996 1997 1998 1999 2000 2001 2002 2003 2004 2005 2006 2007 2008 (R) 2009 (R) 2010 2011TOTAL transportation 40,800 56,500 76,500 124,400 226,500 357,400 442,900 418,300 451,300 485,300 528,200 554,100 598,900 641,800 669,200 730,500 798,400 814,100 818,400 857,000 909,100 978,000 1,007,000 1,049,900 1,029,700 879,200 960,500 1,079,400User-operated transportation, total 39,510 55,325 74,483 121,054 218,784 349,065 433,278 409,458 444,552 479,512 523,379 548,274 592,165 631,797 658,024 719,714 780,631 802,062 811,282 850,517 903,498 974,480 998,766 1,044,162 1,019,543 869,903 948,045 1,063,296New cars and net purchases <strong>of</strong> used cars 16,571 25,191 26,754 36,775 57,243 110,679 118,988 103,658 112,410 120,391 133,268 132,634 135,930 139,384 146,306 155,938 160,260 157,556 155,296 144,639 144,787 153,122 154,218 148,960 133,657 115,966 118,367 131,424New and used trucks and RVs 606 1,284 2,667 7,739 11,849 40,988 63,882 60,337 70,115 80,809 91,229 96,231 108,636 123,810 144,833 165,365 173,295 195,945 216,558 227,020 229,372 223,740 207,409 216,067 168,822 162,840 183,990 198,425Motor vehicle parts and accessories 2,487 3,450 6,087 10,287 17,926 23,483 28,254 27,803 28,727 30,797 33,737 35,366 37,647 39,133 39,477 41,069 41,788 41,260 41,674 42,785 44,327 46,590 48,240 50,055 48,912 46,188 49,568 53,309Repair and rental a 5,262 7,214 11,776 18,971 32,597 58,035 82,033 78,832 86,705 95,755 108,622 121,371 134,351 147,753 154,548 166,189 176,972 181,925 179,036 180,816 185,721 194,580 201,926 208,683 205,596 190,135 190,560 199,200Gasoline and oil 12,004 14,751 21,921 39,703 86,689 97,205 111,440 108,852 112,864 114,518 116,492 120,410 130,494 134,428 121,791 136,456 172,929 168,083 160,273 192,793 231,555 283,798 314,665 342,973 384,516 278,711 330,122 403,787Parking fees and tolls 567 816 1,205 1,652 2,529 4,004 5,171 5,546 6,427 6,864 7,281 7,766 8,405 9,482 10,687 11,463 12,318 12,859 12,747 13,393 14,221 15,036 15,334 15,657 16,322 16,341 16,960 18,018Insurance premiums, less claims paid b 2,013 2,619 4,073 5,927 9,951 14,671 23,510 24,430 27,304 30,378 32,750 34,496 36,702 37,807 40,382 43,234 43,069 44,434 45,698 49,071 53,515 57,614 56,974 61,767 61,718 59,722 58,478 59,133Purchased intercity transportation, total 1,447 2,145 4,156 7,402 15,376 21,014 29,468 28,827 29,338 31,973 34,231 37,071 40,241 45,141 49,015 52,325 59,015 53,237 50,195 53,837 57,220 58,903 61,162 63,741 64,159 57,614 59,348 63,011Railroad 448 429 395 474 588 616 696 697 546 526 488 482 489 490 519 555 635 697 726 713 719 733 810 906 996 919 1,033 1,103Intercity bus 154 206 311 455 873 754 615 674 682 724 776 836 895 1,022 1,118 1,202 1,360 1,410 1,412 1,394 1,353 1,306 1,303 1,206 1,302 1,091 938 997Airline 678 1,279 3,075 5,890 12,768 18,088 25,891 25,069 25,581 27,742 29,226 31,072 33,269 37,216 40,269 43,042 49,166 42,873 39,515 43,348 46,163 47,654 49,368 51,596 51,603 45,811 46,970 49,823Other c 167 231 375 583 1,147 1,556 2,266 2,387 2,529 2,981 3,741 4,681 5,588 6,413 7,109 7,526 7,854 8,257 8,542 8,382 8,985 9,210 9,681 10,033 10,258 9,793 10,407 11,088Purchased local transportation, total 1,904 1,958 2,906 4,019 4,864 7,093 9,701 10,468 11,153 11,507 11,761 11,738 11,958 11,931 12,910 13,309 13,947 14,703 14,752 15,161 16,545 17,444 19,072 18,941 19,834 20,394 20,762 21,791Mass transit system 1,295 1,346 1,726 2,051 2,998 4,521 7,124 7,843 8,567 8,794 8,962 8,749 8,796 8,673 9,411 10,040 10,876 11,336 11,298 11,952 12,769 13,415 14,624 14,558 15,493 16,033 16,218 17,300Taxi 609 612 1,180 1,968 1,866 2,572 2,577 2,625 2,586 2,713 2,799 2,989 3,162 3,258 3,499 3,269 3,071 3,367 3,454 3,209 3,776 4,029 4,448 4,383 4,341 4,361 4,544 4,491KEY: R = revised; RVs = recreational vehicles.aAlso includes greasing, washing, storage, and leasing.bConsists <strong>of</strong> premiums plus premium supplements less normal losses and dividends paid to policyholders for motor vehicles insurance.cConsists <strong>of</strong> baggage charges, coastal and inland waterway fares, travel agents' fees, airports bus fares, and limousine services.NOTESNumbers may not add to totals due to rounding.SOURCEU.S. <strong>Department</strong> <strong>of</strong> Commerce, Bureau <strong>of</strong> Economic Analysis, National Income and Product Accounts Tables , tables 2.5.5 and 2.4.5U , availableat http://www.bea.gov/national/index.htm as <strong>of</strong> Sept. 25, 2012.
- Page 1:
NationalTransportationStatistics
- Page 4 and 5:
AcknowledgmentsU.S. Department of T
- Page 7 and 8:
Table of ContentsINTRODUCTIONTable
- Page 9 and 10:
1-56 U.S. Waterborne Freight (Updat
- Page 11 and 12:
SECTION E. RAILROAD2-39 Railroad an
- Page 13 and 14:
3-35 Transportation Expenditures by
- Page 15 and 16:
4-51 Air Pollution Trends in Select
- Page 18:
IntroductionCompiled and published
- Page 21:
SOURCESU.S. resident population, ag
- Page 25 and 26:
Table 1-1: System Mileage Within th
- Page 27 and 28:
Table 1-3: Number of U.S. Airports
- Page 29 and 30:
Table 1-5: U.S. Public Road and Str
- Page 31 and 32:
Table 1-7: Number of Stations Serve
- Page 33 and 34:
Table 1-9: ADA-Accessible Rail Tran
- Page 36:
Section BVehicle, Aircraft, andVess
- Page 39 and 40:
Table 1-12: U.S. Sales or Deliverie
- Page 41 and 42:
Table 1-14: U.S. Automobile and Tru
- Page 43 and 44:
Table 1-16: Retail a New Passenger
- Page 45 and 46:
Table 1-18: Retail Sales of New Car
- Page 47 and 48:
Table 1-20: Period Sales, Market Sh
- Page 49 and 50:
Table 1-22: Number of Trucks by Wei
- Page 51 and 52:
Taiwan U U U 116 132 124 101 113 11
- Page 53:
Section CCondition
- Page 56 and 57:
Table 1-26: Average Age of Automobi
- Page 58 and 59:
Table 1-28: Condition of U.S. Highw
- Page 60 and 61:
Table 1-30: Condition of Urban Bus
- Page 62 and 63:
Table 1-32: Class I Railroad Locomo
- Page 64 and 65:
Table 1-34: U.S. Flag Vessels by Ty
- Page 66 and 67:
Table 1-36: Roadway Vehicle-Miles T
- Page 68 and 69:
Table 1-38: Average Length of Haul,
- Page 70 and 71:
Table 1-40: U.S. Passenger-Miles (M
- Page 72 and 73:
Table 1-42: Long-Distance Travel in
- Page 74 and 75:
Table 1-43: Long-Distance Travel in
- Page 76 and 77:
Table 1-45: Air Passenger Travel Ar
- Page 79:
Section DTravel and GoodsMovement
- Page 82 and 83:
Table 1-48: U.S.-Mexican Border Lan
- Page 84 and 85:
Table 1-50: U.S. Ton-Miles of Freig
- Page 86 and 87:
Table 1-52: U.S.-Canadian Border La
- Page 88 and 89:
Table 1-54: U.S.-Mexican Border Lan
- Page 90 and 91:
Table 1-56: U.S. Waterborne Freight
- Page 92 and 93:
Table 1-58: Freight Activity in the
- Page 94 and 95:
Table 1-60: Value of U.S. Land Expo
- Page 96 and 97:
Table 1-61M: Crude Oil and Petroleu
- Page 98:
Table 1-63: U.S. Hazardous Material
- Page 102 and 103:
Table 1-64: Passengers Boarded and
- Page 104 and 105:
Table 1-66: Flight Operations Arriv
- Page 106 and 107:
Table 1-68: Major U.S. Air Carrier
- Page 108 and 109:
Table 1-69: Annual Person-Hours of
- Page 110 and 111:
Table 1-70: Travel Time IndexShort-
- Page 112 and 113:
Table 1-71: Annual Roadway Congesti
- Page 114:
Table 1-73: Amtrak On-Time Performa
- Page 118 and 119:
Table 2-1: Transportation Fatalitie
- Page 120 and 121:
Table 2-3: Transportation Accidents
- Page 122 and 123:
Table 2-5: Highway-Rail Grade-Cross
- Page 124 and 125:
Table 2-7: Transportation-Related O
- Page 127:
Section BAir
- Page 130 and 131:
Table 2-10: U.S. Commuter Air Carri
- Page 132 and 133:
Table 2-12: U.S. Commuter Air Carri
- Page 134 and 135:
Table 2-14: U.S. General Aviation a
- Page 136 and 137:
Table 2-16b: Prohibited Items Inter
- Page 139:
Section CHighway
- Page 142 and 143:
Table 2-18: Motor Vehicle Fatalitie
- Page 144 and 145:
Table 2-20: Occupant and Nonmotoris
- Page 146 and 147:
Table 2-22: Motorcycle Rider Safety
- Page 148 and 149:
Table 2-24: Bus Occupant Safety Dat
- Page 150 and 151:
Table 2-26: Fatalities by Highest B
- Page 152 and 153:
Table 2-28: Motor Vehicle Fatal Cra
- Page 154 and 155:
Table 2-30: Safety Belt and Motorcy
- Page 157: Section DTransit
- Page 160 and 161: Table 2-33: Transit Safety Data by
- Page 162 and 163: d The number of Unlinked passenger
- Page 164 and 165: Table 2-36: Transit and Grade-Cross
- Page 166 and 167: Table 2-38: Reports of Violent Crim
- Page 168: KEY: N = data do not exist.a The ki
- Page 172 and 173: Table 2-39: Railroad and Grade-Cros
- Page 174 and 175: Table 2-41: Train Fatalities, Injur
- Page 176 and 177: Table 2-43: Railroad System Safety
- Page 178: Section FWater
- Page 181 and 182: Table 2-46: Waterborne Transportati
- Page 183 and 184: Table 2-48: Personal Watercraft Saf
- Page 186: Section GPipeline
- Page 190: Chapter 3Transportation andthe Econ
- Page 193 and 194: Table 3-2: U.S. Gross Domestic Prod
- Page 195 and 196: Table 3-4: U.S. Gross Domestic Prod
- Page 197 and 198: Table 3-6: U.S. Gross Domestic Dema
- Page 199 and 200: Table 3-8: Contributions to Gross D
- Page 201 and 202: Table 3-10: National Transportation
- Page 204 and 205: Table 3-11: Sales Price of Transpor
- Page 206 and 207: Table 3-13: Producer Price Indices
- Page 210 and 211: Table 3-17: Average Cost of Owning
- Page 212: Table 3-19: Average Passenger Fares
- Page 216 and 217: Table 3-20: Average Passenger Reven
- Page 218 and 219: Table 3-22: Total Operating Revenue
- Page 220 and 221: Table 3-24: Employment in Transport
- Page 222 and 223: Table 3-26: Median Weekly Earnings
- Page 224: Table 3-28: Labor Productivity Indi
- Page 228 and 229: Table 3-29: Federal, State, and Loc
- Page 230 and 231: Table 3-31: Summary of Transportati
- Page 232 and 233: Table 3-33: Transportation Revenues
- Page 234 and 235: Table 3-35: Transportation Expendit
- Page 236 and 237: Table 3-37: Federal Transportation
- Page 239: Chapter 4Transportation, Energy,and
- Page 242 and 243: Table 4-2: U.S. Consumption of Ener
- Page 245: Section BTransportation EnergyConsu
- Page 248 and 249: Table 4-5: Fuel Consumption by Mode
- Page 250 and 251: Table 4-7: Domestic Demand for Gaso
- Page 252 and 253: Table 4-9: Motor Vehicle Fuel Consu
- Page 254 and 255: Table 4-11: Light Duty Vehicle, Sho
- Page 256 and 257: Table 4-13: Single-Unit 2-Axle 6-Ti
- Page 258 and 259:
Table 4-15: Bus Fuel Consumption an
- Page 260 and 261:
Table 4-17: Class I Rail Freight Fu
- Page 262 and 263:
Table 4-19: U.S. Government Energy
- Page 265 and 266:
Table 4-20: Energy Intensity of Pas
- Page 267 and 268:
Table 4-22: Energy Intensity of Lig
- Page 269 and 270:
Table 4-24: Energy Intensity of Tra
- Page 271 and 272:
Table 4-26: Energy Intensity of Amt
- Page 273 and 274:
Table 4-28: Annual Wasted Fuel Due
- Page 275 and 276:
Table 4-29: Annual Wasted Fuel Per
- Page 278:
Section DAir Pollution
- Page 281 and 282:
Table 4-31: Federal Exhaust Emissio
- Page 283 and 284:
1968-Table 4-33: Federal Exhaust Em
- Page 285 and 286:
Table 4-35: Federal Exhaust Emissio
- Page 287 and 288:
KEY: CO = carbon monoxide; HC = hyd
- Page 289 and 290:
Table 4-38: Federal Exhaust Emissio
- Page 291 and 292:
KEY: CO = carbon monoxide; g = gram
- Page 293 and 294:
KEY: bhp = brake horsepower; bhph =
- Page 295 and 296:
Table 4-42: Tier 2 Federal Exhaust
- Page 297 and 298:
Table 4-44: Estimated National Aver
- Page 299 and 300:
Table 4-46: Estimated National Emis
- Page 301 and 302:
Table 4-48: Estimated National Emis
- Page 303 and 304:
Table 4-50: Estimated National Emis
- Page 305 and 306:
Monmouth-Ocean, NJ 5 21 4 41 34 31
- Page 307 and 308:
Table 4-52: Areas in Nonattainment
- Page 310:
Section EWater Pollution, Noise,and
- Page 313 and 314:
Table 4-55: Leaking Underground Sto
- Page 315 and 316:
Table 4-57: Number of People Residi
- Page 318:
appendix aMetric ConversionTables
- Page 321 and 322:
Table 1-4M: Kilometers of Public Ro
- Page 323 and 324:
Table 1-35M: U.S. Vehicle-Kilometer
- Page 325 and 326:
Table 1-38M: Average Length of Haul
- Page 327 and 328:
a Includes freight, express, and ma
- Page 329 and 330:
Table 1-56M: U.S. Waterborne Freigh
- Page 331 and 332:
Table 4-3M: Domestic Demand for Ref
- Page 333 and 334:
Table 4-6M: Energy Consumption by M
- Page 335 and 336:
Table 4-8M: Certificated Air Carrie
- Page 337 and 338:
Table 4-11M: Light Duty Vehicle, Sh
- Page 339 and 340:
Table 4-13M: Single-Unit 2-Axle 6-T
- Page 341 and 342:
Table 4-15M: Bus Fuel Consumption a
- Page 343 and 344:
Table 4-17M: Class I Rail Freight F
- Page 345 and 346:
Table 4-19M: U.S. Government Energy
- Page 347 and 348:
Table 4-21M: Energy Intensity of Ce
- Page 349 and 350:
Table 4-23M: Average Fuel Efficienc
- Page 351 and 352:
Table 4-25M: Energy Intensity of Cl
- Page 353 and 354:
Appendix B: GlossaryAIR CARRIER: A
- Page 355 and 356:
Appendix B: GlossaryCOLLISION WITH
- Page 357 and 358:
Appendix B: GlossaryFEDERAL ENERGY
- Page 359 and 360:
Appendix B: GlossaryINJURY (Rail):
- Page 361 and 362:
Appendix B: GlossaryMOTOR BUS (Tran
- Page 363 and 364:
Appendix B: GlossaryPERSONAL BUSINE
- Page 365 and 366:
Appendix B: GlossarySUBCOMPACT CAR:
- Page 367 and 368:
appendix cAcronyms and InitialismsA
- Page 370:
appendix dModal Profiles
- Page 373 and 374:
Air Carrier Profile continuedPerfor
- Page 375 and 376:
Air Carrier Profile continuedPerfor
- Page 377 and 378:
Highway ProfileFINANCIAL 1960 1970
- Page 379 and 380:
General Aviation ProfileINVENTORY 1
- Page 381 and 382:
Motorcycle f f f f 50 50 50 50 50 5
- Page 383 and 384:
KEY: R = revised; U = data are unav
- Page 385 and 386:
Transit ProfileFINANCIAL 1960 1970
- Page 387 and 388:
161960-2006: Fatalities and Injured
- Page 389 and 390:
SAFETY d,9Number of fatalities, rai
- Page 391 and 392:
SAFETYFatalities in waterborne tran
- Page 393 and 394:
Natural Gas Pipeline ProfileFINANCI
- Page 395:
appendix eSource andAccuracy Statem
- Page 398 and 399:
agencies receiving funds through th
- Page 400 and 401:
solicitations of all federally regu
- Page 402 and 403:
Passenger Car, Truck, Bus, and Recr
- Page 404 and 405:
Highway, Total (registered vehicles
- Page 406 and 407:
after 1996. Some jurisdictions fail
- Page 408 and 409:
adherence to federal guidelines reg
- Page 410 and 411:
year. Also, expansion factors are u
- Page 412 and 413:
PassengerAir CarrierThe U.S. Depart
- Page 414 and 415:
The data are from Waterborne Commer
- Page 416 and 417:
The Transborder Surface Freight Dat
- Page 418 and 419:
A second data source for air-carrie
- Page 420 and 421:
Appendix EData Source and Accuracy
- Page 422 and 423:
when data are entered, they are che
- Page 424 and 425:
vehicles, and 15 were deleted becau
- Page 426 and 427:
TABLE 2-4. Distribution of Transpor
- Page 428 and 429:
BEA personal consumption expenditur
- Page 430 and 431:
Transportation-related government p
- Page 432 and 433:
information on their data collectio
- Page 434 and 435:
AccuracyAs in all surveys, the accu
- Page 436 and 437:
The American Public Transit Associa
- Page 438 and 439:
Government EmploymentThe Office of
- Page 440 and 441:
specifications or equations, should
- Page 442 and 443:
As mentioned above, the Highway Rev
- Page 444 and 445:
Highway ExpendituresFederal Highway
- Page 446 and 447:
consistency between the different m
- Page 448 and 449:
Appendix EData Source and Accuracy
- Page 450 and 451:
when data are entered, they are che
- Page 452 and 453:
vehicles, and 15 were deleted becau
- Page 454 and 455:
TABLE 2-4. Distribution of Transpor
- Page 456 and 457:
agencies receiving funds through th
- Page 458 and 459:
solicitations of all federally regu
- Page 460 and 461:
Passenger Car, Truck, Bus, and Recr
- Page 462 and 463:
Highway, Total (registered vehicles
- Page 464 and 465:
after 1996. Some jurisdictions fail
- Page 466 and 467:
adherence to federal guidelines reg
- Page 468 and 469:
year. Also, expansion factors are u
- Page 470 and 471:
PassengerAir CarrierThe U.S. Depart
- Page 472 and 473:
The data are from Waterborne Commer
- Page 474 and 475:
The Transborder Surface Freight Dat
- Page 476 and 477:
A second data source for air-carrie
- Page 478 and 479:
Appendix EData Source and Accuracy
- Page 480 and 481:
If transportation had been reviewed
- Page 482 and 483:
Alternative FuelsIn addition to oxy
- Page 484 and 485:
RailThe data are from Railroad Fact
- Page 486 and 487:
multiplied by the average peak peri
- Page 488 and 489:
In general, lead emissions are esti
- Page 490 and 491:
The number of the people exposed to
- Page 492 and 493:
Appendix EData Source and Accuracy
- Page 494 and 495:
If transportation had been reviewed
- Page 496 and 497:
Alternative FuelsIn addition to oxy
- Page 498 and 499:
RailThe data are from Railroad Fact
- Page 500 and 501:
multiplied by the average peak peri
- Page 502 and 503:
In general, lead emissions are esti
- Page 504 and 505:
The number of the people exposed to