Table 1-50: U.S. Ton-Miles <strong>of</strong> Freight (<strong>BTS</strong> Special Tabulation) (Millions)1980 1981 1982 1983 1984 1985 1986 1987 1988 1989 1990 1991 1992 1993 1994 1995 1996 1997 1998TOTAL U.S. ton-miles <strong>of</strong> freight 3,403,914 3,366,875 3,195,481 3,251,875 3,340,129 3,313,853 3,328,265 3,474,497 3,597,014 3,567,788 3,621,806 3,635,965 3,746,255 3,767,227 3,944,809 4,104,069 4,173,925 4,179,233 4,228,376Air 4,840 5,090 5,140 5,870 6,500 6,710 7,340 8,670 9,330 10,210 10,420 9,960 10,990 11,540 12,030 12,720 13,760 13,900 14,140Truck 629,574 630,798 646,589 673,913 706,782 716,693 735,095 774,798 800,729 828,375 848,643 867,799 890,088 927,831 987,764 1,033,875 1,061,781 1,110,376 1,139,594Railroad 932,000 924,000 810,000 841,000 900,091 876,209 891,235 951,940 1,025,683 1,045,628 1,064,408 1,041,929 1,098,379 1,135,016 1,221,073 1,317,010 1,377,095 1,391,089 1,448,352Domestic water transportation 921,835 929,413 886,469 919,566 887,719 892,971 873,401 895,415 890,029 815,550 833,544 848,399 856,683 789,657 814,917 807,728 764,687 707,410 672,795Coastwise 631,149 634,765 632,707 649,750 593,923 610,977 580,889 586,818 561,595 483,889 479,134 502,133 502,311 448,404 457,600 440,345 408,086 349,843 314,864Lakewise 61,747 62,148 35,623 43,088 49,784 48,184 43,198 50,077 58,160 58,308 60,930 55,339 55,784 56,438 58,263 59,704 58,335 62,166 61,654Internal 227,343 231,184 217,027 225,628 242,855 232,708 248,117 257,336 269,036 272,157 292,393 289,959 297,638 283,894 297,762 306,329 296,791 294,023 294,896Intraport 1,596 1,316 1,112 1,100 1,157 1,102 1,197 1,184 1,238 1,196 1,087 968 950 921 1,292 1,350 1,475 1,378 1,381Pipeline 915,666 877,574 847,284 811,526 839,037 821,270 821,195 843,673 871,243 868,025 864,792 867,878 890,114 903,183 909,025 932,737 956,602 956,458 953,495Oil and oil products 588,000 564,000 566,000 556,000 568,000 564,000 578,000 587,000 601,000 584,000 584,100 578,500 588,800 592,900 591,400 601,100 619,200 616,500 619,800Natural Gas 327,666 313,574 281,284 255,526 271,037 257,270 243,195 256,673 270,243 284,025 280,692 289,378 301,314 310,283 317,625 331,637 337,402 339,958 333,695KEY: R = revised.NOTES<strong>BTS</strong> developed a more comprehensive and reliable estimates <strong>of</strong> ton-miles for the Air, Truck, Rail, Water , and Pipeline modes than are presented in table 1-49. These improved estimates are notcomparable to data in table 1-49.Numbers may not add to totals due to rounding.SOURCEU.S. <strong>Department</strong> <strong>of</strong> <strong>Transportation</strong>, Research and Innovative Technology Administration (RITA), Bureau <strong>of</strong> <strong>Transportation</strong> Statistics (<strong>BTS</strong>), special tabulation.
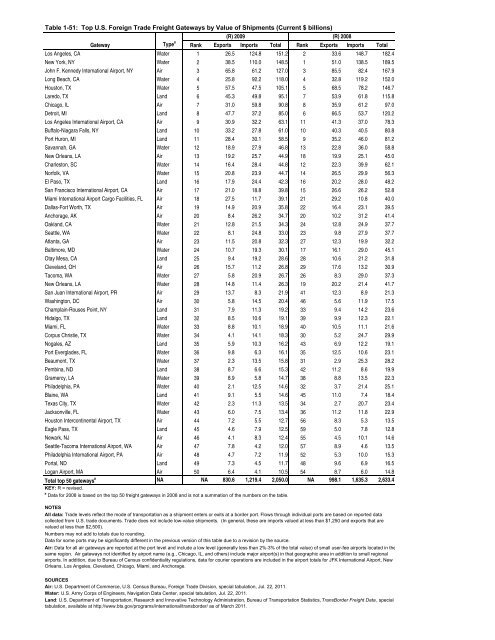
Table 1-51: Top U.S. Foreign Trade Freight Gateways by Value <strong>of</strong> Shipments (Current $ billions)(R) 2009 (R) 2008Gateway Type a Rank Exports Imports Total Rank Exports Imports TotalLos Angeles, CA Water 1 26.5 124.8 151.2 2 33.6 148.7 182.4New York, NY Water 2 38.5 110.0 148.5 1 51.0 138.5 189.5John F. Kennedy International Airport, NY Air 3 65.8 61.2 127.0 3 85.5 82.4 167.9Long Beach, CA Water 4 25.8 92.2 118.0 4 32.8 119.2 152.0Houston, TX Water 5 57.5 47.5 105.1 5 68.5 78.2 146.7Laredo, TX Land 6 45.3 49.8 95.1 7 53.9 61.8 115.8Chicago, IL Air 7 31.0 59.8 90.8 8 35.9 61.2 97.0Detroit, MI Land 8 47.7 37.2 85.0 6 66.5 53.7 120.2Los Angeles International Airport, CA Air 9 30.9 32.2 63.1 11 41.3 37.0 78.3Buffalo-Niagara Falls, NY Land 10 33.2 27.8 61.0 10 40.3 40.5 80.8Port Huron, MI Land 11 28.4 30.1 58.5 9 35.2 46.0 81.2Savannah, GA Water 12 18.9 27.9 46.8 13 22.8 36.0 58.8New Orleans, LA Air 13 19.2 25.7 44.9 18 19.9 25.1 45.0Charleston, SC Water 14 16.4 28.4 44.8 12 22.3 39.9 62.1Norfolk, VA Water 15 20.8 23.9 44.7 14 26.5 29.9 56.3El Paso, TX Land 16 17.9 24.4 42.3 16 20.2 28.0 48.2San Francisco International Airport, CA Air 17 21.0 18.8 39.8 15 26.6 26.2 52.8Miami International Airport Cargo Facilities, FL Air 18 27.5 11.7 39.1 21 29.2 10.8 40.0Dallas-Fort Worth, TX Air 19 14.9 20.9 35.8 22 16.4 23.1 39.5Anchorage, AK Air 20 8.4 26.2 34.7 20 10.2 31.2 41.4Oakland, CA Water 21 12.8 21.5 34.3 24 12.8 24.9 37.7Seattle, WA Water 22 8.1 24.8 33.0 23 9.8 27.9 37.7Atlanta, GA Air 23 11.5 20.8 32.3 27 12.3 19.9 32.2Baltimore, MD Water 24 10.7 19.3 30.1 17 16.1 29.0 45.1Otay Mesa, CA Land 25 9.4 19.2 28.6 28 10.6 21.2 31.8Cleveland, OH Air 26 15.7 11.2 26.8 29 17.6 13.2 30.9Tacoma, WA Water 27 5.8 20.9 26.7 26 8.3 29.0 37.3New Orleans, LA Water 28 14.8 11.4 26.3 19 20.2 21.4 41.7San Juan International Airport, PR Air 29 13.7 8.3 21.9 41 12.3 8.9 21.3Washington, DC Air 30 5.8 14.5 20.4 46 5.6 11.9 17.5Champlain-Rouses Point, NY Land 31 7.9 11.3 19.2 33 9.4 14.2 23.6Hidalgo, TX Land 32 8.5 10.6 19.1 39 9.9 12.3 22.1Miami, FL Water 33 8.8 10.1 18.9 40 10.5 11.1 21.6Corpus Christie, TX Water 34 4.1 14.1 18.3 30 5.2 24.7 29.9Nogales, AZ Land 35 5.9 10.3 16.2 43 6.9 12.2 19.1Port Everglades, FL Water 36 9.8 6.3 16.1 35 12.5 10.6 23.1Beaumont, TX Water 37 2.3 13.5 15.8 31 2.9 25.3 28.2Pembina, ND Land 38 8.7 6.6 15.3 42 11.2 8.6 19.9Gramercy, LA Water 39 8.9 5.8 14.7 38 8.8 13.5 22.3Philadelphia, PA Water 40 2.1 12.5 14.6 32 3.7 21.4 25.1Blaine, WA Land 41 9.1 5.5 14.6 45 11.0 7.4 18.4Texas City, TX Water 42 2.3 11.3 13.5 34 2.7 20.7 23.4Jacksonville, FL Water 43 6.0 7.5 13.4 36 11.2 11.8 22.9Houston Intercontinental Airport, TX Air 44 7.2 5.5 12.7 56 8.3 5.3 13.5Eagle Pass, TX Land 45 4.6 7.9 12.5 59 5.0 7.8 12.8Newark, NJ Air 46 4.1 8.3 12.4 55 4.5 10.1 14.6Seattle-Tacoma International Airport, WA Air 47 7.8 4.2 12.0 57 8.9 4.6 13.5Philadelphia International Airport, PA Air 48 4.7 7.2 11.9 52 5.3 10.0 15.3Portal, ND Land 49 7.3 4.5 11.7 48 9.6 6.9 16.5Logan Airport, MA Air 50 6.4 4.1 10.5 54 8.7 6.0 14.8Total top 50 gateways a NA NA 830.6 1,219.4 2,050.0 NA 998.1 1,635.3 2,633.4KEY: R = revised.a Data for 2008 is based on the top 50 freight gateways in 2008 and is not a summation <strong>of</strong> the numbers on the table.NOTESAll data: Trade levels reflect the mode <strong>of</strong> transportation as a shipment enters or exits at a border port. Flows through individual ports are based on reported datacollected from U.S. trade documents. Trade does not include low-value shipments. (In general, these are imports valued at less than $1,250 and exports that arevalued at less than $2,500).Numbers may not add to totals due to rounding.Data for some ports may be significantly different in the previous version <strong>of</strong> this table due to a revision by the source.Air: Data for all air gateways are reported at the port level and include a low level (generally less than 2%-3% <strong>of</strong> the total value) <strong>of</strong> small user-fee airports located in thesame region. Air gateways not identified by airport name (e.g., Chicago, IL, and others) include major airport(s) in that geographic area in addition to small regionalairports. In addition, due to Bureau <strong>of</strong> Census confidentiality regulations, data for courier operations are included in the airport totals for JFK International Airport, NewOrleans, Los Angeles, Cleveland, Chicago, Miami, and Anchorage.SOURCESAir: U.S. <strong>Department</strong> <strong>of</strong> Commerce, U.S. Census Bureau, Foreign Trade Division, special tabulation, Jul. 22, 2011.Water: U.S. Army Corps <strong>of</strong> Engineers, Navigation Data Center, special tabulation, Jul. 22, 2011.Land: U.S. <strong>Department</strong> <strong>of</strong> <strong>Transportation</strong>, Research and Innovative Technology Administration, Bureau <strong>of</strong> <strong>Transportation</strong> Statistics, TransBorder Freight Data , specialtabulation, available at http://www.bts.gov/programs/international/transborder/ as <strong>of</strong> March 2011.
- Page 1:
NationalTransportationStatistics
- Page 4 and 5:
AcknowledgmentsU.S. Department of T
- Page 7 and 8:
Table of ContentsINTRODUCTIONTable
- Page 9 and 10:
1-56 U.S. Waterborne Freight (Updat
- Page 11 and 12:
SECTION E. RAILROAD2-39 Railroad an
- Page 13 and 14:
3-35 Transportation Expenditures by
- Page 15 and 16:
4-51 Air Pollution Trends in Select
- Page 18:
IntroductionCompiled and published
- Page 21:
SOURCESU.S. resident population, ag
- Page 25 and 26:
Table 1-1: System Mileage Within th
- Page 27 and 28:
Table 1-3: Number of U.S. Airports
- Page 29 and 30:
Table 1-5: U.S. Public Road and Str
- Page 31 and 32:
Table 1-7: Number of Stations Serve
- Page 33 and 34: Table 1-9: ADA-Accessible Rail Tran
- Page 36: Section BVehicle, Aircraft, andVess
- Page 39 and 40: Table 1-12: U.S. Sales or Deliverie
- Page 41 and 42: Table 1-14: U.S. Automobile and Tru
- Page 43 and 44: Table 1-16: Retail a New Passenger
- Page 45 and 46: Table 1-18: Retail Sales of New Car
- Page 47 and 48: Table 1-20: Period Sales, Market Sh
- Page 49 and 50: Table 1-22: Number of Trucks by Wei
- Page 51 and 52: Taiwan U U U 116 132 124 101 113 11
- Page 53: Section CCondition
- Page 56 and 57: Table 1-26: Average Age of Automobi
- Page 58 and 59: Table 1-28: Condition of U.S. Highw
- Page 60 and 61: Table 1-30: Condition of Urban Bus
- Page 62 and 63: Table 1-32: Class I Railroad Locomo
- Page 64 and 65: Table 1-34: U.S. Flag Vessels by Ty
- Page 66 and 67: Table 1-36: Roadway Vehicle-Miles T
- Page 68 and 69: Table 1-38: Average Length of Haul,
- Page 70 and 71: Table 1-40: U.S. Passenger-Miles (M
- Page 72 and 73: Table 1-42: Long-Distance Travel in
- Page 74 and 75: Table 1-43: Long-Distance Travel in
- Page 76 and 77: Table 1-45: Air Passenger Travel Ar
- Page 79: Section DTravel and GoodsMovement
- Page 82 and 83: Table 1-48: U.S.-Mexican Border Lan
- Page 86 and 87: Table 1-52: U.S.-Canadian Border La
- Page 88 and 89: Table 1-54: U.S.-Mexican Border Lan
- Page 90 and 91: Table 1-56: U.S. Waterborne Freight
- Page 92 and 93: Table 1-58: Freight Activity in the
- Page 94 and 95: Table 1-60: Value of U.S. Land Expo
- Page 96 and 97: Table 1-61M: Crude Oil and Petroleu
- Page 98: Table 1-63: U.S. Hazardous Material
- Page 102 and 103: Table 1-64: Passengers Boarded and
- Page 104 and 105: Table 1-66: Flight Operations Arriv
- Page 106 and 107: Table 1-68: Major U.S. Air Carrier
- Page 108 and 109: Table 1-69: Annual Person-Hours of
- Page 110 and 111: Table 1-70: Travel Time IndexShort-
- Page 112 and 113: Table 1-71: Annual Roadway Congesti
- Page 114: Table 1-73: Amtrak On-Time Performa
- Page 118 and 119: Table 2-1: Transportation Fatalitie
- Page 120 and 121: Table 2-3: Transportation Accidents
- Page 122 and 123: Table 2-5: Highway-Rail Grade-Cross
- Page 124 and 125: Table 2-7: Transportation-Related O
- Page 127: Section BAir
- Page 130 and 131: Table 2-10: U.S. Commuter Air Carri
- Page 132 and 133: Table 2-12: U.S. Commuter Air Carri
- Page 134 and 135:
Table 2-14: U.S. General Aviation a
- Page 136 and 137:
Table 2-16b: Prohibited Items Inter
- Page 139:
Section CHighway
- Page 142 and 143:
Table 2-18: Motor Vehicle Fatalitie
- Page 144 and 145:
Table 2-20: Occupant and Nonmotoris
- Page 146 and 147:
Table 2-22: Motorcycle Rider Safety
- Page 148 and 149:
Table 2-24: Bus Occupant Safety Dat
- Page 150 and 151:
Table 2-26: Fatalities by Highest B
- Page 152 and 153:
Table 2-28: Motor Vehicle Fatal Cra
- Page 154 and 155:
Table 2-30: Safety Belt and Motorcy
- Page 157:
Section DTransit
- Page 160 and 161:
Table 2-33: Transit Safety Data by
- Page 162 and 163:
d The number of Unlinked passenger
- Page 164 and 165:
Table 2-36: Transit and Grade-Cross
- Page 166 and 167:
Table 2-38: Reports of Violent Crim
- Page 168:
KEY: N = data do not exist.a The ki
- Page 172 and 173:
Table 2-39: Railroad and Grade-Cros
- Page 174 and 175:
Table 2-41: Train Fatalities, Injur
- Page 176 and 177:
Table 2-43: Railroad System Safety
- Page 178:
Section FWater
- Page 181 and 182:
Table 2-46: Waterborne Transportati
- Page 183 and 184:
Table 2-48: Personal Watercraft Saf
- Page 186:
Section GPipeline
- Page 190:
Chapter 3Transportation andthe Econ
- Page 193 and 194:
Table 3-2: U.S. Gross Domestic Prod
- Page 195 and 196:
Table 3-4: U.S. Gross Domestic Prod
- Page 197 and 198:
Table 3-6: U.S. Gross Domestic Dema
- Page 199 and 200:
Table 3-8: Contributions to Gross D
- Page 201 and 202:
Table 3-10: National Transportation
- Page 204 and 205:
Table 3-11: Sales Price of Transpor
- Page 206 and 207:
Table 3-13: Producer Price Indices
- Page 208 and 209:
Table 3-15: Personal Expenditures b
- Page 210 and 211:
Table 3-17: Average Cost of Owning
- Page 212:
Table 3-19: Average Passenger Fares
- Page 216 and 217:
Table 3-20: Average Passenger Reven
- Page 218 and 219:
Table 3-22: Total Operating Revenue
- Page 220 and 221:
Table 3-24: Employment in Transport
- Page 222 and 223:
Table 3-26: Median Weekly Earnings
- Page 224:
Table 3-28: Labor Productivity Indi
- Page 228 and 229:
Table 3-29: Federal, State, and Loc
- Page 230 and 231:
Table 3-31: Summary of Transportati
- Page 232 and 233:
Table 3-33: Transportation Revenues
- Page 234 and 235:
Table 3-35: Transportation Expendit
- Page 236 and 237:
Table 3-37: Federal Transportation
- Page 239:
Chapter 4Transportation, Energy,and
- Page 242 and 243:
Table 4-2: U.S. Consumption of Ener
- Page 245:
Section BTransportation EnergyConsu
- Page 248 and 249:
Table 4-5: Fuel Consumption by Mode
- Page 250 and 251:
Table 4-7: Domestic Demand for Gaso
- Page 252 and 253:
Table 4-9: Motor Vehicle Fuel Consu
- Page 254 and 255:
Table 4-11: Light Duty Vehicle, Sho
- Page 256 and 257:
Table 4-13: Single-Unit 2-Axle 6-Ti
- Page 258 and 259:
Table 4-15: Bus Fuel Consumption an
- Page 260 and 261:
Table 4-17: Class I Rail Freight Fu
- Page 262 and 263:
Table 4-19: U.S. Government Energy
- Page 265 and 266:
Table 4-20: Energy Intensity of Pas
- Page 267 and 268:
Table 4-22: Energy Intensity of Lig
- Page 269 and 270:
Table 4-24: Energy Intensity of Tra
- Page 271 and 272:
Table 4-26: Energy Intensity of Amt
- Page 273 and 274:
Table 4-28: Annual Wasted Fuel Due
- Page 275 and 276:
Table 4-29: Annual Wasted Fuel Per
- Page 278:
Section DAir Pollution
- Page 281 and 282:
Table 4-31: Federal Exhaust Emissio
- Page 283 and 284:
1968-Table 4-33: Federal Exhaust Em
- Page 285 and 286:
Table 4-35: Federal Exhaust Emissio
- Page 287 and 288:
KEY: CO = carbon monoxide; HC = hyd
- Page 289 and 290:
Table 4-38: Federal Exhaust Emissio
- Page 291 and 292:
KEY: CO = carbon monoxide; g = gram
- Page 293 and 294:
KEY: bhp = brake horsepower; bhph =
- Page 295 and 296:
Table 4-42: Tier 2 Federal Exhaust
- Page 297 and 298:
Table 4-44: Estimated National Aver
- Page 299 and 300:
Table 4-46: Estimated National Emis
- Page 301 and 302:
Table 4-48: Estimated National Emis
- Page 303 and 304:
Table 4-50: Estimated National Emis
- Page 305 and 306:
Monmouth-Ocean, NJ 5 21 4 41 34 31
- Page 307 and 308:
Table 4-52: Areas in Nonattainment
- Page 310:
Section EWater Pollution, Noise,and
- Page 313 and 314:
Table 4-55: Leaking Underground Sto
- Page 315 and 316:
Table 4-57: Number of People Residi
- Page 318:
appendix aMetric ConversionTables
- Page 321 and 322:
Table 1-4M: Kilometers of Public Ro
- Page 323 and 324:
Table 1-35M: U.S. Vehicle-Kilometer
- Page 325 and 326:
Table 1-38M: Average Length of Haul
- Page 327 and 328:
a Includes freight, express, and ma
- Page 329 and 330:
Table 1-56M: U.S. Waterborne Freigh
- Page 331 and 332:
Table 4-3M: Domestic Demand for Ref
- Page 333 and 334:
Table 4-6M: Energy Consumption by M
- Page 335 and 336:
Table 4-8M: Certificated Air Carrie
- Page 337 and 338:
Table 4-11M: Light Duty Vehicle, Sh
- Page 339 and 340:
Table 4-13M: Single-Unit 2-Axle 6-T
- Page 341 and 342:
Table 4-15M: Bus Fuel Consumption a
- Page 343 and 344:
Table 4-17M: Class I Rail Freight F
- Page 345 and 346:
Table 4-19M: U.S. Government Energy
- Page 347 and 348:
Table 4-21M: Energy Intensity of Ce
- Page 349 and 350:
Table 4-23M: Average Fuel Efficienc
- Page 351 and 352:
Table 4-25M: Energy Intensity of Cl
- Page 353 and 354:
Appendix B: GlossaryAIR CARRIER: A
- Page 355 and 356:
Appendix B: GlossaryCOLLISION WITH
- Page 357 and 358:
Appendix B: GlossaryFEDERAL ENERGY
- Page 359 and 360:
Appendix B: GlossaryINJURY (Rail):
- Page 361 and 362:
Appendix B: GlossaryMOTOR BUS (Tran
- Page 363 and 364:
Appendix B: GlossaryPERSONAL BUSINE
- Page 365 and 366:
Appendix B: GlossarySUBCOMPACT CAR:
- Page 367 and 368:
appendix cAcronyms and InitialismsA
- Page 370:
appendix dModal Profiles
- Page 373 and 374:
Air Carrier Profile continuedPerfor
- Page 375 and 376:
Air Carrier Profile continuedPerfor
- Page 377 and 378:
Highway ProfileFINANCIAL 1960 1970
- Page 379 and 380:
General Aviation ProfileINVENTORY 1
- Page 381 and 382:
Motorcycle f f f f 50 50 50 50 50 5
- Page 383 and 384:
KEY: R = revised; U = data are unav
- Page 385 and 386:
Transit ProfileFINANCIAL 1960 1970
- Page 387 and 388:
161960-2006: Fatalities and Injured
- Page 389 and 390:
SAFETY d,9Number of fatalities, rai
- Page 391 and 392:
SAFETYFatalities in waterborne tran
- Page 393 and 394:
Natural Gas Pipeline ProfileFINANCI
- Page 395:
appendix eSource andAccuracy Statem
- Page 398 and 399:
agencies receiving funds through th
- Page 400 and 401:
solicitations of all federally regu
- Page 402 and 403:
Passenger Car, Truck, Bus, and Recr
- Page 404 and 405:
Highway, Total (registered vehicles
- Page 406 and 407:
after 1996. Some jurisdictions fail
- Page 408 and 409:
adherence to federal guidelines reg
- Page 410 and 411:
year. Also, expansion factors are u
- Page 412 and 413:
PassengerAir CarrierThe U.S. Depart
- Page 414 and 415:
The data are from Waterborne Commer
- Page 416 and 417:
The Transborder Surface Freight Dat
- Page 418 and 419:
A second data source for air-carrie
- Page 420 and 421:
Appendix EData Source and Accuracy
- Page 422 and 423:
when data are entered, they are che
- Page 424 and 425:
vehicles, and 15 were deleted becau
- Page 426 and 427:
TABLE 2-4. Distribution of Transpor
- Page 428 and 429:
BEA personal consumption expenditur
- Page 430 and 431:
Transportation-related government p
- Page 432 and 433:
information on their data collectio
- Page 434 and 435:
AccuracyAs in all surveys, the accu
- Page 436 and 437:
The American Public Transit Associa
- Page 438 and 439:
Government EmploymentThe Office of
- Page 440 and 441:
specifications or equations, should
- Page 442 and 443:
As mentioned above, the Highway Rev
- Page 444 and 445:
Highway ExpendituresFederal Highway
- Page 446 and 447:
consistency between the different m
- Page 448 and 449:
Appendix EData Source and Accuracy
- Page 450 and 451:
when data are entered, they are che
- Page 452 and 453:
vehicles, and 15 were deleted becau
- Page 454 and 455:
TABLE 2-4. Distribution of Transpor
- Page 456 and 457:
agencies receiving funds through th
- Page 458 and 459:
solicitations of all federally regu
- Page 460 and 461:
Passenger Car, Truck, Bus, and Recr
- Page 462 and 463:
Highway, Total (registered vehicles
- Page 464 and 465:
after 1996. Some jurisdictions fail
- Page 466 and 467:
adherence to federal guidelines reg
- Page 468 and 469:
year. Also, expansion factors are u
- Page 470 and 471:
PassengerAir CarrierThe U.S. Depart
- Page 472 and 473:
The data are from Waterborne Commer
- Page 474 and 475:
The Transborder Surface Freight Dat
- Page 476 and 477:
A second data source for air-carrie
- Page 478 and 479:
Appendix EData Source and Accuracy
- Page 480 and 481:
If transportation had been reviewed
- Page 482 and 483:
Alternative FuelsIn addition to oxy
- Page 484 and 485:
RailThe data are from Railroad Fact
- Page 486 and 487:
multiplied by the average peak peri
- Page 488 and 489:
In general, lead emissions are esti
- Page 490 and 491:
The number of the people exposed to
- Page 492 and 493:
Appendix EData Source and Accuracy
- Page 494 and 495:
If transportation had been reviewed
- Page 496 and 497:
Alternative FuelsIn addition to oxy
- Page 498 and 499:
RailThe data are from Railroad Fact
- Page 500 and 501:
multiplied by the average peak peri
- Page 502 and 503:
In general, lead emissions are esti
- Page 504 and 505:
The number of the people exposed to