Air Carrier Pr<strong>of</strong>ile continuedSafety 7 1960 1970 1980 1990 1994 1995 1996 1997 1998 1999 2000 2001 2002 2003 2004 2005 2006Air carrier fatalitiesOperating under 14 CFR 121 (airlines)Scheduled services N N 0 39 239 160 342 3 1 12 89 531 0 22 13 22 50Nonscheduled services N N 1 0 0 8 38 5 0 0 3 0 0 0 1 0 0Operating under 14 CFR 135Scheduled services (commuters) N N 37 6 25 9 14 46 0 12 5 13 0 2 0 0 2Nonscheduled services (on–demand air taxis) N N 105 51 63 52 63 39 45 38 71 60 35 42 64 18 16Total 499 146 143 96 327 229 457 93 46 62 168 604 35 66 78 40 68Air carrier accidentsOperating under 14 CFR 121 (airlines)Scheduled services N N 15 21 18 30 31 43 41 40 49 41 35 51 (R) 24 (R) 34 25Nonscheduled services N N 4 3 5 6 6 6 9 11 7 5 6 3 (R) 6 (R) 6 6Operating under 14 CFR 135Scheduled services (commuters) N N 38 15 10 12 11 16 8 13 12 7 7 2 4 6 3Nonscheduled services (on–demand air taxis) N N 171 107 85 75 90 82 77 74 80 72 60 (R) 73 66 66 54Total 90 55 228 146 118 123 138 147 135 138 148 125 108 (R) 129 100 (R) 112 88Fatal air carrier accidentsOperating under 14 CFR 121 (airlines)Scheduled services N N 0 6 4 2 3 3 1 2 3 6 0 2 1 3 2Nonscheduled services N N 1 0 0 1 2 1 0 0 0 0 0 0 1 0 0Operating under 14 CFR 135Scheduled services (commuters) N N 8 3 3 2 1 5 0 5 1 2 0 1 0 0 1Nonscheduled services (on–demand air taxis) N N 46 29 26 24 29 15 17 12 22 18 18 18 (R) 23 11 10Total 17 8 55 38 33 29 35 24 18 19 26 26 18 (R) 21 25 14 13KEY: N = data do not exist; R = revised; U = data are not available.aSome totals include data not in the table; thus totals may not equal sum <strong>of</strong> table data.bIncludes scheduled and nonscheduled (charter) operators. By Sec. 2 <strong>of</strong> the Airline Deregulation Act <strong>of</strong> 1978 "charter air carrier" and "charter air transportation" replacedsupplemental air carriers and supplemental air transportation, which were formerly Sec. 101(36) and (37) <strong>of</strong> the Act. The 24 pre-deregulation supplemental carriers now havescheduled service authority.cTotal includes only those carriers who have reported employment statistics to <strong>BTS</strong>' Office <strong>of</strong> Airline Information. Full-time equivalent employees count two part-timeemployees as one full-time equivalent employee. Prior to 1980, there was no breakout for part-time employees so earlier numbers will overstate full-time equivalentemployees.dData does not include small-certificated and commuter carriers prior to 2002. Small-certificated and commuter carriers began reporting T1 data in January <strong>of</strong> 2002 forAlaskan carriers and in October <strong>of</strong> 2002 for the remainder <strong>of</strong> the U.S.e Passenger travel totals do not include Canada because the source does not record departures and arrivals to and from Canada.fTotal Revenue Ton-Miles includes passenger, freight, express, and mail.g Total revenue ton-miles <strong>of</strong> freight includes freight, express, and mail.NOTESDomestic encompasses operations within and between the 50 states <strong>of</strong> the United States, the District <strong>of</strong> Columbia, Puerto Rico, and the Virgin Islands. It also encompassesCanadian and Mexican transborder operations (U.S. airlines only). All other operations are considered international.Data in the Financial and Performance (excluding International Air Passengers) sectins was revised for 1990 to 2005 to be consistent with the online source as <strong>of</strong> Nov. 2,2007.SOURCESUnless otherwise noted, refer to chapter tables for sources.1 1960-1970: Civil Aeronautics Board, Handbook <strong>of</strong> Airline Statistics, 1969 and 1973 (Washington, DC), pp. 69 and 71. 1980: Civil Aeronautics Board, Air Carrier FinancialStatistics , December 1981 (Washington, DC), pp. 3/28, 42, and 44. 1990-2006: U.S. <strong>Department</strong> <strong>of</strong> <strong>Transportation</strong>, Bureau <strong>of</strong> <strong>Transportation</strong> Statistics, Form 41 Air CarrierFinancial Reports, Schedules P11 and P12, available at http://www.transtats.bts.gov/databases.asp?Mode_ID=1&Mode_Desc=Aviation&Subject_ID2=0, as <strong>of</strong> Nov. 2, 20072 1960: U.S. <strong>Department</strong> <strong>of</strong> <strong>Transportation</strong>, Bureau <strong>of</strong> <strong>Transportation</strong> Statistics, Office <strong>of</strong> Airline Information, http://www.bts.gov/oai/employees/employcov.html as <strong>of</strong> Oct. 14,2003. 1970-2006: U.S. <strong>Department</strong> <strong>of</strong> <strong>Transportation</strong>, Bureau <strong>of</strong> <strong>Transportation</strong> Statistics, Office <strong>of</strong> Airline Information,http://www.bts.gov/programs/airline_information/number_<strong>of</strong>_employees/certificated_carriers/ as <strong>of</strong> Nov. 2, 2007.3 Ibid., personal communication, Oct. 17, 2003, Sept. 10, 2004, Feb. 1, 2007, and Nov. 2, 20074 1960-1970: Civil Aeronautics Board, Handbook <strong>of</strong> Airline Statistics, 1969 and 1973 (Washington, DC), Part III, tables 2, 4, 7, and 13. 1980: Civil Aeronautics Board, AirCarrier Financial Statistics , December 1981 (Washington, DC), pp. 2, 5, 46, and 86. 1990-2006: U.S. <strong>Department</strong> <strong>of</strong> <strong>Transportation</strong>, Bureau <strong>of</strong> <strong>Transportation</strong> Statistics, T1:U.S. Air Carrier Traffic and Capacity Summary by Service Class, available athttp://www.transtats.bts.gov/Tables.asp?DB_ID=130&DB_Name=Air%20Carrier%20Summary%20Data%20%28Form%2041%20and%20298C%20Summary%20Data%29&DB_Short_Name=Air%20Carrier%20Summary, as <strong>of</strong> Nov. 2, 20075See sources 1 and 4.6 1960-70: U.S. <strong>Department</strong> <strong>of</strong> Justice, Immigration and Naturalization Service, Report <strong>of</strong> Passenger Travel Between the U.S. and Foreign Countries, 1960, 1970(Washington, DC). 1980-2006: U.S. <strong>Department</strong> <strong>of</strong> <strong>Transportation</strong>, Research and Special Programs Administration, U.S. International Air Travel Statistics (Washington,DC: Annual issues), tables IIa and IId. 2006: U.S. <strong>Department</strong> <strong>of</strong> Commerce, Office <strong>of</strong> Travel and Tourism Industries, U.S. International Air Travel Statistics.7 National <strong>Transportation</strong> Safety Board, Internet site http://www.ntsb.gov/aviation/stats.htm as <strong>of</strong> November 2007 and personal communication.
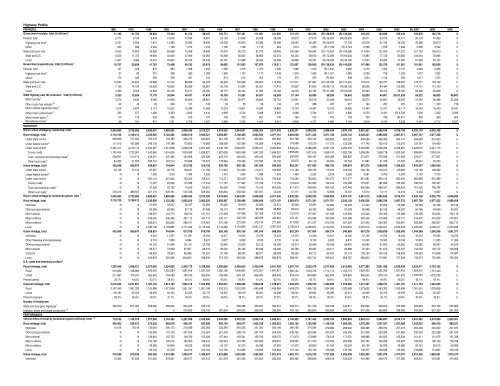
Highway Pr<strong>of</strong>ileFINANCIAL 1960 1970 1980 1990 1994 1995 1996 1997 1998 1999 2000 2001 2002 2003 2004 2005 2006 (R) 2007 2008 2009Government receipts, total ($ millions) 1 11,193 21,763 39,834 75,444 91,312 96,347 102,771 107,421 111,581 121,650 131,115 132,324 (R) 138,878 (R) 139,246 145,315 154,690 165,443 193,876 192,718 UFederal, total 2,771 6,160 9,949 14,576 17,854 19,851 23,196 21,648 24,509 26,008 30,819 27,670 (R) 28,344 (R) 29,878 30,911 33,070 34,171 36,134 41,905 UHighway trust fund a 2,531 5,464 7,615 13,380 16,582 18,835 22,036 20,500 23,396 25,085 29,445 26,365 (R) 26,616 27,755 28,576 31,194 32,333 33,568 38,873 UOther 240 696 2,334 1,196 1,272 1,016 1,160 1,148 1,113 923 1,374 1,305 (R) 1,728 (R) 2,123 2,335 1,876 1,838 2,566 3,032 <strong>US</strong>tate and local, total 8,422 15,603 29,885 60,868 73,458 76,496 79,575 85,773 87,072 95,642 100,296 104,654 (R) 110,534 (R) 109,368 114,404 121,620 131,272 157,742 150,813 <strong>US</strong>tate and D.C. 6,055 11,737 19,666 40,026 47,699 50,064 52,808 58,087 58,806 63,274 66,434 68,873 (R) 72,296 (R) 69,633 72,860 77,725 83,685 105,834 97,686 ULocal 2,367 3,866 10,219 20,842 25,759 26,432 26,767 27,686 28,266 32,368 33,862 35,781 (R) 38,238 (R) 39,735 41,544 43,895 47,587 51,908 53,127 UGovernment expenditures, total ($ millions) 1 10,757 20,829 41,763 75,408 90,192 93,478 98,082 101,953 107,975 116,011 122,697 129,900 (R) 138,639 (R) 143,605 147,489 152,700 161,061 181,061 182,058 UFederal, total 197 425 874 664 1,306 1,402 1,598 1,315 1,375 1,428 1,680 1,913 (R) 1,841 2,383 3,470 1,902 2,191 2,284 2,906 UHighway trust fund a 27 83 315 358 965 1,092 1,384 1,103 1,170 1,249 1,304 1,463 (R) 1,241 1,685 2,436 758 1,236 1,213 1,532 UOther b 170 342 559 306 341 310 214 212 205 179 376 450 (R) 600 698 1,034 1,144 955 1,071 1,374 <strong>US</strong>tate and local, total 10,560 20,404 40,889 74,744 88,886 92,076 96,484 100,638 106,600 114,583 121,017 127,987 (R) 136,798 (R) 141,222 144,019 150,797 158,870 178,777 179,152 <strong>US</strong>tate and D.C. 7,125 14,100 25,936 45,609 55,569 56,981 59,709 61,534 65,507 71,415 76,997 81,803 (R) 85,712 (R) 88,183 88,026 94,484 100,090 114,151 114,153 ULocal 3,435 6,304 14,953 29,135 33,317 35,095 36,775 39,104 41,093 43,168 44,020 46,184 (R) 51,086 (R) 53,039 55,993 56,313 58,780 64,626 64,999 <strong>US</strong>tate highway user tax revenues c , total ($ millions) 5,323 10,284 17,178 35,944 46,437 47,424 49,756 51,381 54,507 56,269 57,144 58,508 58,299 59,642 62,830 64,801 (R) 67,539 69,332 68,605 66,807Motor fuel tax 2 3,374 6,433 9,485 19,658 25,860 26,881 27,555 28,477 29,803 30,753 31,981 32,519 33,046 34,016 35,272 35,831 36,632 37,345 36,486 35,392Other motor fuel receipts d,2 22 44 92 220 101 108 63 55 58 134 179 298 297 277 194 202 972 1,181 1,100 718Motor vehicle registration fees 3 1,514 2,873 5,173 10,257 12,388 11,942 13,234 13,631 14,552 14,882 13,704 14,437 13,316 13,606 14,443 15,377 16,117 16,524 16,443 16,431Other motor vehicle fees e,3 235 577 1,490 3,353 4,505 4,416 4,689 4,704 5,068 5,350 5,696 5,764 6,077 5,885 6,373 6,451 (R) 6,769 7,000 7,002 6,935Motor carrier taxes f,3 110 176 323 695 875 770 726 729 861 740 784 753 703 709 730 786 (R) 811 828 863 804Miscellaneous fees 3 68 181 615 1,761 2,708 3,307 3,489 3,785 4,165 4,410 4,800 4,737 4,860 5,149 5,819 6,154 6,239 6,454 6,712 6,527INVENTORYRural / urban mileage by ownership, total 4 3,545,693 3,730,082 3,859,837 3,866,926 3,906,595 3,912,227 3,919,652 3,944,601 3,906,304 3,917,245 3,936,241 3,948,335 3,966,494 3,974,103 3,981,521 3,995,644 4,016,734 4,032,134 4,042,768 URural mileage, total 3,116,125 3,169,412 3,230,936 3,122,282 3,092,810 3,092,521 3,092,887 3,108,493 3,064,650 3,071,181 3,084,000 3,071,332 3,071,768 3,033,133 3,000,247 2,985,804 2,987,371 2,987,767 2,977,228 UUnder state control 658,896 707,002 750,479 702,486 690,372 690,924 691,156 692,767 660,834 660,682 661,798 663,134 662,855 652,522 648,555 636,339 635,114 633,933 631,653 UUnder federal control g 111,912 187,696 246,130 178,188 173,650 170,568 168,938 167,369 118,369 116,846 116,698 119,270 117,751 120,208 117,740 123,413 123,370 125,761 124,460 UUnder local control 2,345,317 2,274,714 2,234,327 2,241,608 2,228,788 2,231,029 2,232,793 2,248,357 2,285,447 2,293,653 2,305,504 2,288,928 2,291,162 2,260,403 2,233,952 2,226,052 2,228,887 2,228,073 2,221,115 UCounty roads 1,742,404 1,732,981 1,542,984 1,616,634 1,624,982 1,626,927 1,627,639 1,642,468 1,647,025 1,649,291 1,656,906 1,637,616 1,628,510 1,623,786 1,608,094 1,598,718 1,605,540 1,599,849 1,593,014 UTown, township and municipal roads h 538,651 510,174 458,231 437,460 423,908 424,529 426,170 426,433 426,340 590,206 592,623 595,197 606,398 580,825 573,871 575,569 571,922 579,577 577,651 UOther local roads h 64,262 31,559 233,112 187,514 179,898 179,573 178,984 179,456 212,082 54,156 55,975 56,115 56,254 55,792 51,987 51,765 51,425 48,647 50,450 UUrban mileage, total 429,568 560,670 628,901 744,644 813,785 819,706 826,765 836,108 841,654 846,064 852,241 877,003 894,726 940,970 981,274 1,009,840 1,029,363 1,044,367 1,065,540 UUnder state control 50,158 74,103 97,287 95,778 109,947 111,766 111,924 112,226 110,017 109,956 110,195 109,136 110,434 120,033 126,132 140,913 143,960 145,198 148,082 UUnder federal control g N N 1,495 1,024 1,484 1,509 1,470 1,464 1,485 1,503 1,484 2,234 2,819 3,560 3,561 3,783 4,979 5,184 7,070 UUnder local control N N 530,119 647,842 702,354 706,431 713,371 722,418 730,152 734,605 740,562 765,633 781,473 817,377 851,581 865,144 880,424 893,985 910,388 UCounty roads N N 71,357 95,929 115,388 117,518 117,181 117,487 117,016 117,105 116,918 144,065 144,615 156,598 175,601 182,696 185,582 186,518 195,027 UTown and township roads h N N 37,583 42,752 74,630 60,561 60,926 74,402 75,195 605,255 611,473 608,859 624,163 647,448 662,366 668,337 680,424 701,035 708,794 UOther local roads h 379,410 486,567 421,179 509,161 512,336 528,352 535,264 530,529 537,941 12,245 12,171 12,709 12,695 13,331 13,614 14,111 14,418 6,432 6,567 URural / urban mileage by functional system, total 5 3,545,693 3,730,082 3,859,837 3,866,926 3,906,595 3,912,226 3,919,652 3,944,597 3,906,292 3,917,240 3,936,222 3,948,335 3,966,485 3,974,107 3,981,512 3,995,635 4,016,741 4,032,126 4,042,778 4,049,829Rural mileage, total 3,116,125 3,169,412 3,230,936 3,122,282 3,092,810 3,092,520 3,092,887 3,108,488 3,064,649 3,071,181 3,083,979 3,071,331 3,071,761 3,033,138 3,000,236 2,985,796 2,987,375 2,987,758 2,977,222 2,968,458Interstate N N 31,905 33,547 32,457 32,580 32,820 32,819 32,808 32,974 33,048 33,061 32,992 32,048 31,443 30,905 30,586 30,360 30,196 30,142Other principal arterial N N 82,569 83,802 97,175 97,948 98,131 98,257 98,858 98,856 98,919 99,185 98,853 97,038 95,946 95,156 94,937 94,766 94,949 94,051Minor arterial N N 149,057 144,774 138,120 137,151 137,359 137,498 137,308 137,463 137,575 137,587 137,568 135,596 135,449 135,408 135,386 135,296 135,024 135,115Major collector N N 439,000 436,352 431,115 431,712 432,117 432,728 432,408 432,954 433,121 433,284 430,946 424,288 420,046 419,999 419,117 419,437 418,229 415,851Minor collector N N 299,613 293,922 282,011 274,081 273,198 272,350 272,140 271,690 271,803 271,377 270,700 267,524 267,842 264,387 262,841 262,899 262,607 262,710Local N N 2,228,792 2,129,885 2,111,932 2,119,048 2,119,262 2,134,836 2,091,127 2,097,244 2,109,513 2,096,837 2,100,702 2,076,644 2,049,510 2,039,941 2,044,508 2,045,000 2,036,217 2,030,589Urban mileage, total 429,568 560,670 628,901 744,644 813,785 819,706 826,765 836,109 841,643 846,059 852,243 877,004 894,724 940,969 981,276 1,009,839 1,029,366 1,044,368 1,065,556 1,081,371Interstate N N 9,215 11,527 13,126 13,164 13,217 13,249 13,276 13,343 13,379 13,406 13,491 14,460 15,129 15,703 16,044 16,312 16,555 16,578Other freeways and expressways N N 6,774 7,668 8,994 8,970 9,027 9,062 9,163 9,125 9,140 9,126 9,323 9,870 10,246 10,560 10,748 10,913 11,335 11,399Other principal arterial N N 44,155 51,968 53,110 52,796 52,983 53,230 53,132 53,206 53,314 53,056 53,439 56,870 59,695 61,803 62,830 63,282 64,557 64,524Minor arterial N N 66,377 74,659 87,857 88,510 89,020 89,196 89,496 89,399 89,789 89,962 90,411 93,888 97,433 101,673 102,975 104,033 106,172 108,958Collector N N 68,387 78,254 86,089 87,331 87,790 88,042 88,071 88,008 88,200 88,713 89,247 97,114 102,150 106,109 108,833 109,555 113,848 114,687Local N N 433,993 520,568 564,609 568,935 574,728 583,330 588,505 592,978 598,421 622,741 638,813 668,767 696,623 713,991 727,936 740,273 753,089 765,224U.S. roads and streets by surface 6Paved mileage, total 1,230,469 1,658,421 2,072,692 2,254,822 2,342,179 2,378,268 2,380,650 2,409,935 2,420,344 2,451,426 2,501,716 2,523,479 2,577,693 2,612,069 2,577,963 2,601,490 2,629,638 2,635,471 2,734,102 URural 919,082 1,188,080 1,490,050 1,550,283 1,561,649 1,591,334 1,582,166 1,605,804 1,612,251 1,641,877 1,682,140 1,678,795 1,714,714 1,702,175 1,629,423 1,625,390 1,637,819 1,629,207 1,701,343 UUrban 311,387 470,341 582,642 704,539 780,530 786,934 798,484 804,131 808,093 809,549 819,576 844,684 862,979 909,894 948,540 976,100 991,819 1,006,264 1,032,759 UPercent paved 34.7% 44.5% 53.7% 58.3% 60.0% 60.8% 60.5% 60.9% 61.3% 62.4% 63.3% 63.7% 64.8% 65.5% 64.5% 64.9% 65.2% 65.1% 67.4% UUnpaved mileage, total 2,315,224 2,071,661 1,787,145 1,612,104 1,564,416 1,533,958 1,553,537 1,548,349 1,528,549 1,478,977 1,448,319 1,438,723 1,402,995 1,376,283 1,417,527 1,408,757 1,401,791 1,411,779 1,324,245 URural 2,197,043 1,981,332 1,740,886 1,571,999 1,531,161 1,501,186 1,518,310 1,510,330 1,490,488 1,436,969 1,409,279 1,400,129 1,364,900 1,333,969 1,373,622 1,363,383 1,352,456 1,361,551 1,278,838 UUrban 118,181 90,329 46,259 40,105 33,255 32,772 35,227 38,019 38,061 42,008 39,040 38,594 38,095 42,314 43,905 45,374 49,335 50,228 45,407 UPercent unpaved 65.3% 55.5% 46.3% 41.7% 40.0% 39.2% 39.5% 39.1% 38.7% 37.6% 36.7% 36.3% 35.2% 34.5% 35.5% 35.1% 34.8% 34.9% 32.6% UNumber <strong>of</strong> employeesState and local govt. highways 7 532,000 607,000 559,000 569,000 544,233 543,143 U 548,486 530,097 542,612 546,215 551,706 545,249 545,617 542,642 546,220 545,089 522,823 523,156 525,869Highway, street and bridge construction i,8 U U U U 274,000 278,100 287,500 294,200 308,000 336,300 340,100 345,800 345,900 340,100 347,000 350,800 348,300 344,500 327,300 291,300PERFORMANCEVehicle-miles <strong>of</strong> travel by functional system (millions), total718,762 1,109,724 1,527,295 2,144,362 2,357,588 2,422,696 2,484,080 2,552,233 2,628,148 2,690,241 2,746,925 2,781,462 2,855,756 2,890,893 2,962,513 2,989,807 3,014,116 3,047,462 2,973,509 2,953,501j, 9Rural mileage, total 400,463 539,472 672,030 868,878 908,341 933,289 960,194 999,277 1,032,528 1,062,623 1,083,152 1,105,083 1,128,160 1,085,385 1,070,248 1,037,937 1,037,069 1,035,033 990,418 980,227Interstate 10,514 79,516 135,084 200,173 215,568 223,382 232,565 240,255 251,520 260,166 268,180 274,024 279,962 269,945 266,996 258,790 257,913 256,438 243,290 241,873Other principal arterial N N 132,958 175,133 207,569 215,567 221,403 228,716 237,704 244,045 248,725 253,056 257,587 245,345 241,046 233,999 231,865 232,054 222,298 221,430Minor arterial N N 129,816 155,733 149,760 153,028 157,444 163,341 165,780 169,275 171,874 173,889 176,218 171,251 168,898 164,933 162,634 161,411 151,975 151,038Major collector N N 150,186 190,512 182,000 186,212 190,923 201,790 203,580 206,831 209,659 211,312 213,503 203,368 200,792 193,288 193,287 193,333 186,139 176,799Minor collector N N 39,282 49,948 48,529 49,936 50,107 52,310 54,288 57,622 57,572 59,650 61,504 60,294 60,139 58,299 58,088 58,181 55,019 53,899Local N N 84,704 97,379 104,915 105,164 107,752 112,865 119,656 124,684 127,142 133,152 139,386 135,182 132,377 128,628 133,282 133,886 131,697 135,189Urban mileage, total 318,299 570,252 855,265 1,275,484 1,449,247 1,489,407 1,523,886 1,552,956 1,595,620 1,627,618 1,663,773 1,676,379 1,727,596 1,805,508 1,892,265 1,951,870 1,977,047 2,012,429 1,983,091 1,973,274Interstate 13,365 81,532 161,242 278,901 330,577 341,515 351,579 361,433 374,622 383,259 393,465 399,890 408,618 432,633 454,385 469,070 477,283 483,315 476,091 474,963
- Page 1:
NationalTransportationStatistics
- Page 4 and 5:
AcknowledgmentsU.S. Department of T
- Page 7 and 8:
Table of ContentsINTRODUCTIONTable
- Page 9 and 10:
1-56 U.S. Waterborne Freight (Updat
- Page 11 and 12:
SECTION E. RAILROAD2-39 Railroad an
- Page 13 and 14:
3-35 Transportation Expenditures by
- Page 15 and 16:
4-51 Air Pollution Trends in Select
- Page 18:
IntroductionCompiled and published
- Page 21:
SOURCESU.S. resident population, ag
- Page 25 and 26:
Table 1-1: System Mileage Within th
- Page 27 and 28:
Table 1-3: Number of U.S. Airports
- Page 29 and 30:
Table 1-5: U.S. Public Road and Str
- Page 31 and 32:
Table 1-7: Number of Stations Serve
- Page 33 and 34:
Table 1-9: ADA-Accessible Rail Tran
- Page 36:
Section BVehicle, Aircraft, andVess
- Page 39 and 40:
Table 1-12: U.S. Sales or Deliverie
- Page 41 and 42:
Table 1-14: U.S. Automobile and Tru
- Page 43 and 44:
Table 1-16: Retail a New Passenger
- Page 45 and 46:
Table 1-18: Retail Sales of New Car
- Page 47 and 48:
Table 1-20: Period Sales, Market Sh
- Page 49 and 50:
Table 1-22: Number of Trucks by Wei
- Page 51 and 52:
Taiwan U U U 116 132 124 101 113 11
- Page 53:
Section CCondition
- Page 56 and 57:
Table 1-26: Average Age of Automobi
- Page 58 and 59:
Table 1-28: Condition of U.S. Highw
- Page 60 and 61:
Table 1-30: Condition of Urban Bus
- Page 62 and 63:
Table 1-32: Class I Railroad Locomo
- Page 64 and 65:
Table 1-34: U.S. Flag Vessels by Ty
- Page 66 and 67:
Table 1-36: Roadway Vehicle-Miles T
- Page 68 and 69:
Table 1-38: Average Length of Haul,
- Page 70 and 71:
Table 1-40: U.S. Passenger-Miles (M
- Page 72 and 73:
Table 1-42: Long-Distance Travel in
- Page 74 and 75:
Table 1-43: Long-Distance Travel in
- Page 76 and 77:
Table 1-45: Air Passenger Travel Ar
- Page 79:
Section DTravel and GoodsMovement
- Page 82 and 83:
Table 1-48: U.S.-Mexican Border Lan
- Page 84 and 85:
Table 1-50: U.S. Ton-Miles of Freig
- Page 86 and 87:
Table 1-52: U.S.-Canadian Border La
- Page 88 and 89:
Table 1-54: U.S.-Mexican Border Lan
- Page 90 and 91:
Table 1-56: U.S. Waterborne Freight
- Page 92 and 93:
Table 1-58: Freight Activity in the
- Page 94 and 95:
Table 1-60: Value of U.S. Land Expo
- Page 96 and 97:
Table 1-61M: Crude Oil and Petroleu
- Page 98:
Table 1-63: U.S. Hazardous Material
- Page 102 and 103:
Table 1-64: Passengers Boarded and
- Page 104 and 105:
Table 1-66: Flight Operations Arriv
- Page 106 and 107:
Table 1-68: Major U.S. Air Carrier
- Page 108 and 109:
Table 1-69: Annual Person-Hours of
- Page 110 and 111:
Table 1-70: Travel Time IndexShort-
- Page 112 and 113:
Table 1-71: Annual Roadway Congesti
- Page 114:
Table 1-73: Amtrak On-Time Performa
- Page 118 and 119:
Table 2-1: Transportation Fatalitie
- Page 120 and 121:
Table 2-3: Transportation Accidents
- Page 122 and 123:
Table 2-5: Highway-Rail Grade-Cross
- Page 124 and 125:
Table 2-7: Transportation-Related O
- Page 127:
Section BAir
- Page 130 and 131:
Table 2-10: U.S. Commuter Air Carri
- Page 132 and 133:
Table 2-12: U.S. Commuter Air Carri
- Page 134 and 135:
Table 2-14: U.S. General Aviation a
- Page 136 and 137:
Table 2-16b: Prohibited Items Inter
- Page 139:
Section CHighway
- Page 142 and 143:
Table 2-18: Motor Vehicle Fatalitie
- Page 144 and 145:
Table 2-20: Occupant and Nonmotoris
- Page 146 and 147:
Table 2-22: Motorcycle Rider Safety
- Page 148 and 149:
Table 2-24: Bus Occupant Safety Dat
- Page 150 and 151:
Table 2-26: Fatalities by Highest B
- Page 152 and 153:
Table 2-28: Motor Vehicle Fatal Cra
- Page 154 and 155:
Table 2-30: Safety Belt and Motorcy
- Page 157:
Section DTransit
- Page 160 and 161:
Table 2-33: Transit Safety Data by
- Page 162 and 163:
d The number of Unlinked passenger
- Page 164 and 165:
Table 2-36: Transit and Grade-Cross
- Page 166 and 167:
Table 2-38: Reports of Violent Crim
- Page 168:
KEY: N = data do not exist.a The ki
- Page 172 and 173:
Table 2-39: Railroad and Grade-Cros
- Page 174 and 175:
Table 2-41: Train Fatalities, Injur
- Page 176 and 177:
Table 2-43: Railroad System Safety
- Page 178:
Section FWater
- Page 181 and 182:
Table 2-46: Waterborne Transportati
- Page 183 and 184:
Table 2-48: Personal Watercraft Saf
- Page 186:
Section GPipeline
- Page 190:
Chapter 3Transportation andthe Econ
- Page 193 and 194:
Table 3-2: U.S. Gross Domestic Prod
- Page 195 and 196:
Table 3-4: U.S. Gross Domestic Prod
- Page 197 and 198:
Table 3-6: U.S. Gross Domestic Dema
- Page 199 and 200:
Table 3-8: Contributions to Gross D
- Page 201 and 202:
Table 3-10: National Transportation
- Page 204 and 205:
Table 3-11: Sales Price of Transpor
- Page 206 and 207:
Table 3-13: Producer Price Indices
- Page 208 and 209:
Table 3-15: Personal Expenditures b
- Page 210 and 211:
Table 3-17: Average Cost of Owning
- Page 212:
Table 3-19: Average Passenger Fares
- Page 216 and 217:
Table 3-20: Average Passenger Reven
- Page 218 and 219:
Table 3-22: Total Operating Revenue
- Page 220 and 221:
Table 3-24: Employment in Transport
- Page 222 and 223:
Table 3-26: Median Weekly Earnings
- Page 224:
Table 3-28: Labor Productivity Indi
- Page 228 and 229:
Table 3-29: Federal, State, and Loc
- Page 230 and 231:
Table 3-31: Summary of Transportati
- Page 232 and 233:
Table 3-33: Transportation Revenues
- Page 234 and 235:
Table 3-35: Transportation Expendit
- Page 236 and 237:
Table 3-37: Federal Transportation
- Page 239:
Chapter 4Transportation, Energy,and
- Page 242 and 243:
Table 4-2: U.S. Consumption of Ener
- Page 245:
Section BTransportation EnergyConsu
- Page 248 and 249:
Table 4-5: Fuel Consumption by Mode
- Page 250 and 251:
Table 4-7: Domestic Demand for Gaso
- Page 252 and 253:
Table 4-9: Motor Vehicle Fuel Consu
- Page 254 and 255:
Table 4-11: Light Duty Vehicle, Sho
- Page 256 and 257:
Table 4-13: Single-Unit 2-Axle 6-Ti
- Page 258 and 259:
Table 4-15: Bus Fuel Consumption an
- Page 260 and 261:
Table 4-17: Class I Rail Freight Fu
- Page 262 and 263:
Table 4-19: U.S. Government Energy
- Page 265 and 266:
Table 4-20: Energy Intensity of Pas
- Page 267 and 268:
Table 4-22: Energy Intensity of Lig
- Page 269 and 270:
Table 4-24: Energy Intensity of Tra
- Page 271 and 272:
Table 4-26: Energy Intensity of Amt
- Page 273 and 274:
Table 4-28: Annual Wasted Fuel Due
- Page 275 and 276:
Table 4-29: Annual Wasted Fuel Per
- Page 278:
Section DAir Pollution
- Page 281 and 282:
Table 4-31: Federal Exhaust Emissio
- Page 283 and 284:
1968-Table 4-33: Federal Exhaust Em
- Page 285 and 286:
Table 4-35: Federal Exhaust Emissio
- Page 287 and 288:
KEY: CO = carbon monoxide; HC = hyd
- Page 289 and 290:
Table 4-38: Federal Exhaust Emissio
- Page 291 and 292:
KEY: CO = carbon monoxide; g = gram
- Page 293 and 294:
KEY: bhp = brake horsepower; bhph =
- Page 295 and 296:
Table 4-42: Tier 2 Federal Exhaust
- Page 297 and 298:
Table 4-44: Estimated National Aver
- Page 299 and 300:
Table 4-46: Estimated National Emis
- Page 301 and 302:
Table 4-48: Estimated National Emis
- Page 303 and 304:
Table 4-50: Estimated National Emis
- Page 305 and 306:
Monmouth-Ocean, NJ 5 21 4 41 34 31
- Page 307 and 308:
Table 4-52: Areas in Nonattainment
- Page 310:
Section EWater Pollution, Noise,and
- Page 313 and 314:
Table 4-55: Leaking Underground Sto
- Page 315 and 316:
Table 4-57: Number of People Residi
- Page 318:
appendix aMetric ConversionTables
- Page 321 and 322:
Table 1-4M: Kilometers of Public Ro
- Page 323 and 324:
Table 1-35M: U.S. Vehicle-Kilometer
- Page 325 and 326: Table 1-38M: Average Length of Haul
- Page 327 and 328: a Includes freight, express, and ma
- Page 329 and 330: Table 1-56M: U.S. Waterborne Freigh
- Page 331 and 332: Table 4-3M: Domestic Demand for Ref
- Page 333 and 334: Table 4-6M: Energy Consumption by M
- Page 335 and 336: Table 4-8M: Certificated Air Carrie
- Page 337 and 338: Table 4-11M: Light Duty Vehicle, Sh
- Page 339 and 340: Table 4-13M: Single-Unit 2-Axle 6-T
- Page 341 and 342: Table 4-15M: Bus Fuel Consumption a
- Page 343 and 344: Table 4-17M: Class I Rail Freight F
- Page 345 and 346: Table 4-19M: U.S. Government Energy
- Page 347 and 348: Table 4-21M: Energy Intensity of Ce
- Page 349 and 350: Table 4-23M: Average Fuel Efficienc
- Page 351 and 352: Table 4-25M: Energy Intensity of Cl
- Page 353 and 354: Appendix B: GlossaryAIR CARRIER: A
- Page 355 and 356: Appendix B: GlossaryCOLLISION WITH
- Page 357 and 358: Appendix B: GlossaryFEDERAL ENERGY
- Page 359 and 360: Appendix B: GlossaryINJURY (Rail):
- Page 361 and 362: Appendix B: GlossaryMOTOR BUS (Tran
- Page 363 and 364: Appendix B: GlossaryPERSONAL BUSINE
- Page 365 and 366: Appendix B: GlossarySUBCOMPACT CAR:
- Page 367 and 368: appendix cAcronyms and InitialismsA
- Page 370: appendix dModal Profiles
- Page 373 and 374: Air Carrier Profile continuedPerfor
- Page 375: Air Carrier Profile continuedPerfor
- Page 379 and 380: General Aviation ProfileINVENTORY 1
- Page 381 and 382: Motorcycle f f f f 50 50 50 50 50 5
- Page 383 and 384: KEY: R = revised; U = data are unav
- Page 385 and 386: Transit ProfileFINANCIAL 1960 1970
- Page 387 and 388: 161960-2006: Fatalities and Injured
- Page 389 and 390: SAFETY d,9Number of fatalities, rai
- Page 391 and 392: SAFETYFatalities in waterborne tran
- Page 393 and 394: Natural Gas Pipeline ProfileFINANCI
- Page 395: appendix eSource andAccuracy Statem
- Page 398 and 399: agencies receiving funds through th
- Page 400 and 401: solicitations of all federally regu
- Page 402 and 403: Passenger Car, Truck, Bus, and Recr
- Page 404 and 405: Highway, Total (registered vehicles
- Page 406 and 407: after 1996. Some jurisdictions fail
- Page 408 and 409: adherence to federal guidelines reg
- Page 410 and 411: year. Also, expansion factors are u
- Page 412 and 413: PassengerAir CarrierThe U.S. Depart
- Page 414 and 415: The data are from Waterborne Commer
- Page 416 and 417: The Transborder Surface Freight Dat
- Page 418 and 419: A second data source for air-carrie
- Page 420 and 421: Appendix EData Source and Accuracy
- Page 422 and 423: when data are entered, they are che
- Page 424 and 425: vehicles, and 15 were deleted becau
- Page 426 and 427:
TABLE 2-4. Distribution of Transpor
- Page 428 and 429:
BEA personal consumption expenditur
- Page 430 and 431:
Transportation-related government p
- Page 432 and 433:
information on their data collectio
- Page 434 and 435:
AccuracyAs in all surveys, the accu
- Page 436 and 437:
The American Public Transit Associa
- Page 438 and 439:
Government EmploymentThe Office of
- Page 440 and 441:
specifications or equations, should
- Page 442 and 443:
As mentioned above, the Highway Rev
- Page 444 and 445:
Highway ExpendituresFederal Highway
- Page 446 and 447:
consistency between the different m
- Page 448 and 449:
Appendix EData Source and Accuracy
- Page 450 and 451:
when data are entered, they are che
- Page 452 and 453:
vehicles, and 15 were deleted becau
- Page 454 and 455:
TABLE 2-4. Distribution of Transpor
- Page 456 and 457:
agencies receiving funds through th
- Page 458 and 459:
solicitations of all federally regu
- Page 460 and 461:
Passenger Car, Truck, Bus, and Recr
- Page 462 and 463:
Highway, Total (registered vehicles
- Page 464 and 465:
after 1996. Some jurisdictions fail
- Page 466 and 467:
adherence to federal guidelines reg
- Page 468 and 469:
year. Also, expansion factors are u
- Page 470 and 471:
PassengerAir CarrierThe U.S. Depart
- Page 472 and 473:
The data are from Waterborne Commer
- Page 474 and 475:
The Transborder Surface Freight Dat
- Page 476 and 477:
A second data source for air-carrie
- Page 478 and 479:
Appendix EData Source and Accuracy
- Page 480 and 481:
If transportation had been reviewed
- Page 482 and 483:
Alternative FuelsIn addition to oxy
- Page 484 and 485:
RailThe data are from Railroad Fact
- Page 486 and 487:
multiplied by the average peak peri
- Page 488 and 489:
In general, lead emissions are esti
- Page 490 and 491:
The number of the people exposed to
- Page 492 and 493:
Appendix EData Source and Accuracy
- Page 494 and 495:
If transportation had been reviewed
- Page 496 and 497:
Alternative FuelsIn addition to oxy
- Page 498 and 499:
RailThe data are from Railroad Fact
- Page 500 and 501:
multiplied by the average peak peri
- Page 502 and 503:
In general, lead emissions are esti
- Page 504 and 505:
The number of the people exposed to