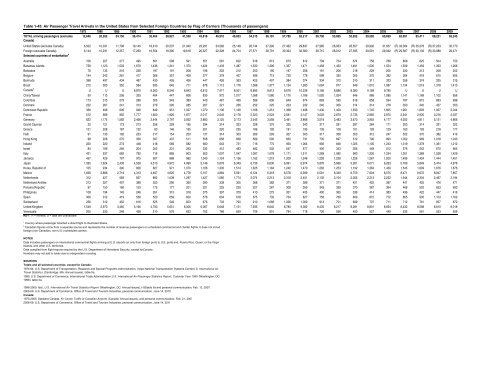
Table 1-45: Air Passenger Travel Arrivals in the United States from Selected Foreign Countries by Flag <strong>of</strong> Carriers (Thousands <strong>of</strong> passengers)TOTAL arriving passengers (excludesCanada)1975 1980 1985 1990 1991 1992 1993 1994 1995 1996 1997 1998 1999 2000 2001 2002 2003 2004 2005 2006 2007 2008 200912,646 20,262 24,156 36,414 35,464 38,927 41,558 43,818 46,910 49,853 54,315 56,181 57,785 62,217 56,700 53,865 53,952 59,582 60,699 62,951 65,411 68,221 65,245United States (excludes Canada) 6,502 10,031 11,798 19,145 18,910 20,537 21,940 23,291 24,582 25,148 26,744 27,390 27,462 29,837 27,985 26,953 26,557 29,992 31,657 (R) 33,364 (R) 35,278 (R) 37,233 35,773Foreign (excludes Canada) 6,144 10,231 12,357 17,269 16,554 18,390 19,618 20,527 22,328 24,704 27,571 28,791 30,324 32,380 28,715 26,912 27,395 29,591 29,042 (R) 29,587 (R) 30,132 (R) 30,988 29,471Selected countries <strong>of</strong> embarkation aAustralia 106 227 277 495 561 598 591 551 581 622 618 613 670 812 739 724 674 758 789 808 625 504 753Bahamas Islands 758 1,123 1,503 1,679 1,436 1,341 1,370 1,424 1,433 1,487 1,530 1,396 1,337 1,471 1,458 1,430 1,491 1,500 1,554 1,509 1,459 1,363 1,266Barbados 76 135 216 228 197 191 208 196 222 212 203 195 197 208 191 206 218 229 205 230 213 208 202Belgium 144 242 281 417 366 357 408 377 379 407 589 715 730 778 598 330 305 375 382 364 418 615 605Bermuda 398 497 434 487 430 405 436 447 426 363 425 407 384 374 334 312 310 311 323 358 374 325 315Brazil 212 300 352 584 635 645 711 878 1,112 1,176 1,388 1,377 1,154 1,280 1,094 977 949 1,010 1,087 1,154 1,219 1,318 1,413Canada b U U U 6,870 6,263 6,546 6,843 6,812 7,417 8,501 8,895 9,613 9,676 10,236 9,166 8,686 8,380 9,189 9,785 U U U UChina/Taiwan 50 113 206 325 404 447 606 830 972 1,017 1,068 1,080 1,170 1,186 1,092 1,024 846 986 1,085 1,141 1,169 1,102 956Colombia 173 315 279 286 305 343 389 443 481 499 586 606 649 674 683 590 618 658 594 787 815 893 998Denmark 222 267 241 313 279 295 285 267 221 236 252 225 223 232 240 309 314 314 278 350 345 427 353Dominican Republic 336 468 606 948 849 951 1,027 1,070 1,136 1,168 1,168 1,251 1,368 1,498 1,430 1,409 1,593 1,745 1,805 1,961 1,893 1,927 2,044France 512 689 955 1,777 1,600 1,926 1,877 2,017 2,045 2,178 2,323 2,523 2,591 3,147 3,023 2,879 2,735 2,965 2,970 2,941 2,935 3,216 3,037Germany 622 1,175 1,582 2,466 2,444 2,797 2,922 2,883 3,125 3,173 3,545 3,558 3,491 3,886 3,519 3,483 3,673 3,955 4,177 4,252 4,811 5,121 4,866Grand Cayman 25 121 173 273 256 229 185 294 314 323 328 370 335 343 317 291 287 284 171 303 314 321 322Greece 121 208 187 132 83 146 165 201 220 235 186 192 191 195 135 108 101 129 129 163 193 218 177Haiti 91 133 192 233 217 154 200 137 314 303 289 293 327 303 317 338 353 312 247 302 370 382 419Hong Kong 98 228 270 356 397 437 511 558 658 668 589 592 650 731 735 697 519 796 893 1,002 969 1,018 1,043Ireland 220 220 274 448 418 569 582 660 642 721 716 775 950 1,064 992 848 1,025 1,105 1,243 1,319 1,378 1,361 1,212Israel 84 189 294 204 202 231 293 332 412 483 482 502 547 577 400 343 356 449 512 576 542 670 665Italy 431 537 662 792 716 885 903 953 1,007 1,047 1,097 1,078 1,171 1,511 1,269 1,082 983 1,220 1,254 1,301 1,369 1,528 1,429Jamaica 457 429 707 975 907 888 982 1,040 1,124 1,136 1,162 1,219 1,209 1,248 1,226 1,238 1,226 1,267 1,200 1,499 1,424 1,444 1,451Japan 1,095 1,624 2,435 4,528 4,510 4,972 4,999 5,149 5,676 6,349 6,736 6,630 6,991 6,974 5,876 5,666 5,261 6,071 6,263 5,769 5,849 5,474 4,978Korea, Republic <strong>of</strong> 105 234 390 826 827 971 1,070 1,166 1,335 1,514 1,625 1,184 1,240 1,470 1,262 1,253 1,192 1,364 1,439 1,545 1,609 1,676 1,676Mexico 1,626 2,886 2,719 4,313 4,467 4,625 4,778 5,107 4,884 5,591 6,124 6,318 6,576 6,999 6,591 6,349 6,753 7,604 8,075 8,471 8,672 8,847 7,857Netherlands 312 427 583 837 892 1,039 1,297 1,427 1,580 1,774 2,074 2,213 2,318 2,401 2,132 2,104 2,055 2,213 2,252 1,944 2,304 2,497 2,194Netherland Antilles 213 327 407 388 353 290 360 390 339 305 368 382 371 389 371 371 401 422 397 441 425 476 471Panama Republic 97 150 180 153 175 177 201 221 225 229 227 267 308 359 343 339 370 387 364 468 502 653 693Philippines 108 194 145 246 261 315 318 375 397 379 410 275 331 405 400 365 339 414 383 496 422 447 416Spain 306 312 419 558 520 659 600 578 604 618 675 732 734 827 758 769 809 872 772 855 905 1,103 1,162Switzerland 236 312 452 616 525 549 603 676 733 790 910 1,068 1,026 1,069 913 701 699 707 711 712 761 857 872United Kingdom 1,549 2,973 3,460 5,166 4,793 5,651 6,006 6,087 6,648 7,131 7,935 8,640 8,780 9,382 8,435 8,217 8,281 8,801 8,654 8,432 8,598 8,810 8,018Venezuela 205 533 248 458 510 576 653 702 786 659 709 810 794 718 730 556 400 527 449 535 561 553 559KEY: R = revised; U = data are unavailablea Country where passenger boarded a direct flight to theUnited States .bCanadian figures come from a separate source and represents the number <strong>of</strong> revenue passengers on scheduled commercial and charter flights. It does not includeforeign (non-Canadian, non-U.S.) scheduled carriers.NOTESData includes passengers on international commercial flights arriving at U.S. airports an only from foreign ports to U.S. ports and, Puerto Rico, Guam, or the VirginIslands, and other U.S. territories.Data compiled from flight reports required by the U.S. <strong>Department</strong> <strong>of</strong> Homeland Security, except forCanada .Numbers may not add to totals due to independent roundingSOURCESTotals and all selected countries, except for Canada:1975-94: U.S. <strong>Department</strong> <strong>of</strong> <strong>Transportation</strong>, Research and Special Programs Administration, Volpe National <strong>Transportation</strong> Systems CenterU.S. International AirTravel Statistics (Cambridge, MA: Annual issues), table IIa.1995: U.S. <strong>Department</strong> <strong>of</strong> Commerce, International Trade Administration,U.S. International Air Passenger Statistics Report, Calendar Year 1995 (Washington, DC:1996), table IIa.1996-2005: Ibid., U.S. International Air Travel Statistics Report (Washington, DC: Annual issues), I-92table IIa and personal communication, Feb. 13, 2007.2006-09: U.S. <strong>Department</strong> <strong>of</strong> Commerce, Office <strong>of</strong> Travel and Tourism Industries, personal communication, June 14, 2010Canada:1975-2005: Statistics Canada, Air Carrier Traffic at Canadian Airports (Canada: Annual issues), and personal communication, Feb. 21, 20072006-09: U.S. <strong>Department</strong> <strong>of</strong> Commerce, Office <strong>of</strong> Travel and Tourism Industries, personal communication, June 14, 2010
Table 1-46: Air Passenger Travel Departures from the United States to Selected Foreign Countries by Flag <strong>of</strong> Carriers (Thousands <strong>of</strong> passengers)1975 1980 1985 1990 1991 1992 1993 1994 1995 1996 1997 1998 1999 2000 2001 2002 2003 2004 2005 2006 2007 2008 2009TOTAL departing passengers12,053 19,256 22,487 34,046 33,286 36,211 38,254 40,349 43,026 45,785 49,684 50,863 53,856 57,498 52,594 48,606 49,968 55,931 58,545 59,477 62,815 64,467 62,299(excludes Canada)United States (excludes Canada) 5,912 9,369 10,696 17,628 17,530 18,858 20,232 21,355 22,231 22,901 24,302 24,513 25,457 27,431 25,483 23,610 24,070 27,249 29,668 (R) 31,492 34,066 34,894 32,791Foreign (excludes Canada) 6,141 9,886 11,791 16,418 15,756 17,353 18,022 18,993 20,795 22,884 25,382 26,350 28,399 30,068 27,111 24,996 25,897 28,683 28,877 (R) 27,985 28,748 29,573 29,508Selected countries <strong>of</strong> debarkation aAustralia 103 245 232 540 581 609 588 522 560 614 606 607 686 806 713 686 672 766 828 879 907 853 1,005Bahamas Islands 704 1,006 1,151 1,279 1,128 1,005 1,046 963 1,024 994 983 955 1,027 1,137 1,007 935 1,101 1,151 1,230 1,252 1,165 1,111 966Barbados 74 126 204 230 199 185 207 208 217 210 200 196 202 214 204 189 206 222 237 246 226 213 204Belgium 134 231 249 395 318 355 372 334 340 380 513 622 713 740 586 265 269 346 369 351 406 514 490Bermuda 372 467 389 277 237 217 247 242 199 196 215 207 206 189 150 165 216 251 261 289 301 296 284Brazil 206 291 322 560 592 659 696 826 1,024 1,135 1,292 1,297 1,134 1,194 1,081 936 928 989 1,094 1,147 1,221 1,334 1,455Canada b N N N 6,870 6,263 6,546 6,798 6,764 7,405 8,477 8,890 9,647 9,692 10,246 9,161 8,672 8,406 9,222 9,807 U U U 11,613China/Taiwan 41 90 187 337 447 481 616 803 891 945 939 934 975 1,026 944 927 770 917 1,008 1,048 1,117 1,064 998Colombia 171 299 294 277 294 324 353 415 461 467 567 588 585 622 649 587 615 640 696 790 859 941 1,015Denmark 188 254 254 307 239 266 272 254 229 227 259 217 214 227 239 316 334 357 318 359 394 378 333Dominican Republic 322 443 528 896 780 881 949 980 995 1,057 1,070 1,108 1,263 1,294 1,214 1,180 1,357 1,466 1,624 1,695 1,647 1,655 1,795France 470 635 894 1,626 1,523 1,769 1,759 1,896 1,868 2,021 2,147 2,289 2,544 3,082 2,927 2,588 2,620 2,887 3,065 3,008 3,047 3,148 2,911Germany 649 1,178 1,539 2,339 2,298 2,627 2,788 2,785 2,883 2,978 3,178 3,210 3,364 3,722 3,389 3,108 3,364 3,747 4,014 4,134 4,611 4,720 4,531Grand Cayman 26 112 161 250 238 196 244 259 264 285 290 305 291 289 271 237 271 255 203 275 300 324 301Greece 123 190 210 129 88 150 150 184 194 206 192 181 170 170 126 102 99 124 115 101 139 138 173Haiti 81 124 169 201 178 139 180 118 292 288 284 295 315 296 300 315 332 286 273 285 338 367 364Hong Kong 59 152 238 310 369 474 477 545 640 651 610 621 621 728 733 657 512 783 894 978 1,046 1,189 1,037Ireland 163 212 233 311 263 316 324 380 409 449 488 554 743 809 797 631 779 837 908 993 1,066 1,070 945Israel 105 186 255 259 249 294 317 367 426 492 499 488 515 480 374 338 363 465 484 475 504 560 649Italy 409 495 660 731 694 873 878 918 955 1,006 1,055 1,041 1,101 1,366 1,182 955 962 1,172 1,246 1,310 1,360 1,290 1,295Jamaica 416 382 607 888 821 796 887 909 987 988 1,018 1,018 1,086 1,095 1,084 1,067 1,126 1,164 1,193 1,335 1,292 1,311 1,274Japan 1,183 1,602 2,255 4,471 4,431 4,795 4,757 4,954 5,452 6,187 6,796 6,487 6,709 6,985 5,993 5,665 5,072 5,819 5,949 5,708 5,810 5,384 4,992Korea, Republic <strong>of</strong> 60 186 333 723 759 887 961 1,082 1,252 1,382 1,461 1,032 1,101 1,307 1,137 1,114 1,110 1,269 1,349 1,386 1,445 1,495 1,636Mexico 1,525 2,886 2,671 4,136 4,230 4,307 4,371 4,632 4,568 5,133 5,613 5,771 6,217 6,510 6,025 5,643 6,075 6,931 7,488 7,615 7,927 8,068 7,208Netherlands 304 409 562 777 881 965 1,150 1,319 1,444 1,636 1,920 1,933 2,009 2,107 1,854 1,722 1,674 1,827 1,931 1,877 2,195 2,353 2,144Netherland Antilles 184 282 395 377 341 309 347 368 295 288 319 340 335 337 344 330 370 384 398 414 419 443 437Panama Republic 100 142 209 183 189 186 194 211 214 221 240 272 299 344 355 343 386 403 422 463 523 645 716Philippines 81 160 165 195 194 241 249 228 281 275 306 218 272 348 309 332 309 376 352 341 399 420 376Spain 260 273 397 540 513 637 576 553 573 577 615 669 708 782 732 688 740 887 799 862 994 1,127 1,203Switzerland 224 306 434 600 527 543 593 657 712 760 811 906 983 1,038 905 671 690 705 696 699 672 724 785United Kingdom 1,446 2,840 3,322 4,903 4,594 5,245 5,682 5,918 6,372 6,693 7,475 8,143 8,717 9,154 8,180 7,659 7,962 8,709 8,497 8,156 8,394 8,561 7,954Venezuela 198 518 245 444 488 565 641 686 778 644 698 782 793 694 728 533 405 534 567 552 620 642 580KEY: N = data do not exist; R = revised; U = data are unavailable.aCountry where passenger deboarded a direct flight from the United States.bCanadian figures come from a separate source and represents the number <strong>of</strong> revenue passengers on scheduled commercial and charter flights. It does not include foreign (non-Canadian,non-U.S.) scheduled carriers.NOTESIt includes passengers on international commercial flights departing U.S. airports, and travelers between U.S. airports in the 50 states, Puerto Rico, Guam, or the Virgin Islands, and otherU.S. territories. Data compiled from flight reports required by the U.S. Immigration and Naturalization Service, except for Canada data.Numbers may not add to totals due to independent rounding.SOURCESTotals and all selected countries, except for Canada:1975-94: U.S. <strong>Department</strong> <strong>of</strong> <strong>Transportation</strong>, Research and Special Programs Administration, Volpe National <strong>Transportation</strong> Systems Center, U.S. International Air Travel Statistics(Cambridge, MA: Annual issues), table IId.1995: U.S. <strong>Department</strong> <strong>of</strong> Commerce, International Trade Administration, U.S. International Air Passenger Statistics Report, Calendar Year 1995 (Washington, DC: 1996), table IId.1996-2006: Ibid., U.S. International Air Travel Statistics Report (Washington, DC: Annual issues), table IId, and personal communication, Jan. 10, 2008.2007-09: U.S. <strong>Department</strong> <strong>of</strong> Commerce, Office <strong>of</strong> Travel and Tourism Industries, personal communication, June 14, 2010.Canada:1974-2005: Statistics Canada, Air Carrier Traffic at Canadian Airports (Canada: Annual issues) and personal communication, Feb. 21, 2007.2006-09: U.S. <strong>Department</strong> <strong>of</strong> Commerce, Office <strong>of</strong> Travel and Tourism Industries, personal communication, June 14, 2010.
- Page 1:
NationalTransportationStatistics
- Page 4 and 5:
AcknowledgmentsU.S. Department of T
- Page 7 and 8:
Table of ContentsINTRODUCTIONTable
- Page 9 and 10:
1-56 U.S. Waterborne Freight (Updat
- Page 11 and 12:
SECTION E. RAILROAD2-39 Railroad an
- Page 13 and 14:
3-35 Transportation Expenditures by
- Page 15 and 16:
4-51 Air Pollution Trends in Select
- Page 18:
IntroductionCompiled and published
- Page 21:
SOURCESU.S. resident population, ag
- Page 25 and 26: Table 1-1: System Mileage Within th
- Page 27 and 28: Table 1-3: Number of U.S. Airports
- Page 29 and 30: Table 1-5: U.S. Public Road and Str
- Page 31 and 32: Table 1-7: Number of Stations Serve
- Page 33 and 34: Table 1-9: ADA-Accessible Rail Tran
- Page 36: Section BVehicle, Aircraft, andVess
- Page 39 and 40: Table 1-12: U.S. Sales or Deliverie
- Page 41 and 42: Table 1-14: U.S. Automobile and Tru
- Page 43 and 44: Table 1-16: Retail a New Passenger
- Page 45 and 46: Table 1-18: Retail Sales of New Car
- Page 47 and 48: Table 1-20: Period Sales, Market Sh
- Page 49 and 50: Table 1-22: Number of Trucks by Wei
- Page 51 and 52: Taiwan U U U 116 132 124 101 113 11
- Page 53: Section CCondition
- Page 56 and 57: Table 1-26: Average Age of Automobi
- Page 58 and 59: Table 1-28: Condition of U.S. Highw
- Page 60 and 61: Table 1-30: Condition of Urban Bus
- Page 62 and 63: Table 1-32: Class I Railroad Locomo
- Page 64 and 65: Table 1-34: U.S. Flag Vessels by Ty
- Page 66 and 67: Table 1-36: Roadway Vehicle-Miles T
- Page 68 and 69: Table 1-38: Average Length of Haul,
- Page 70 and 71: Table 1-40: U.S. Passenger-Miles (M
- Page 72 and 73: Table 1-42: Long-Distance Travel in
- Page 74 and 75: Table 1-43: Long-Distance Travel in
- Page 79: Section DTravel and GoodsMovement
- Page 82 and 83: Table 1-48: U.S.-Mexican Border Lan
- Page 84 and 85: Table 1-50: U.S. Ton-Miles of Freig
- Page 86 and 87: Table 1-52: U.S.-Canadian Border La
- Page 88 and 89: Table 1-54: U.S.-Mexican Border Lan
- Page 90 and 91: Table 1-56: U.S. Waterborne Freight
- Page 92 and 93: Table 1-58: Freight Activity in the
- Page 94 and 95: Table 1-60: Value of U.S. Land Expo
- Page 96 and 97: Table 1-61M: Crude Oil and Petroleu
- Page 98: Table 1-63: U.S. Hazardous Material
- Page 102 and 103: Table 1-64: Passengers Boarded and
- Page 104 and 105: Table 1-66: Flight Operations Arriv
- Page 106 and 107: Table 1-68: Major U.S. Air Carrier
- Page 108 and 109: Table 1-69: Annual Person-Hours of
- Page 110 and 111: Table 1-70: Travel Time IndexShort-
- Page 112 and 113: Table 1-71: Annual Roadway Congesti
- Page 114: Table 1-73: Amtrak On-Time Performa
- Page 118 and 119: Table 2-1: Transportation Fatalitie
- Page 120 and 121: Table 2-3: Transportation Accidents
- Page 122 and 123: Table 2-5: Highway-Rail Grade-Cross
- Page 124 and 125: Table 2-7: Transportation-Related O
- Page 127:
Section BAir
- Page 130 and 131:
Table 2-10: U.S. Commuter Air Carri
- Page 132 and 133:
Table 2-12: U.S. Commuter Air Carri
- Page 134 and 135:
Table 2-14: U.S. General Aviation a
- Page 136 and 137:
Table 2-16b: Prohibited Items Inter
- Page 139:
Section CHighway
- Page 142 and 143:
Table 2-18: Motor Vehicle Fatalitie
- Page 144 and 145:
Table 2-20: Occupant and Nonmotoris
- Page 146 and 147:
Table 2-22: Motorcycle Rider Safety
- Page 148 and 149:
Table 2-24: Bus Occupant Safety Dat
- Page 150 and 151:
Table 2-26: Fatalities by Highest B
- Page 152 and 153:
Table 2-28: Motor Vehicle Fatal Cra
- Page 154 and 155:
Table 2-30: Safety Belt and Motorcy
- Page 157:
Section DTransit
- Page 160 and 161:
Table 2-33: Transit Safety Data by
- Page 162 and 163:
d The number of Unlinked passenger
- Page 164 and 165:
Table 2-36: Transit and Grade-Cross
- Page 166 and 167:
Table 2-38: Reports of Violent Crim
- Page 168:
KEY: N = data do not exist.a The ki
- Page 172 and 173:
Table 2-39: Railroad and Grade-Cros
- Page 174 and 175:
Table 2-41: Train Fatalities, Injur
- Page 176 and 177:
Table 2-43: Railroad System Safety
- Page 178:
Section FWater
- Page 181 and 182:
Table 2-46: Waterborne Transportati
- Page 183 and 184:
Table 2-48: Personal Watercraft Saf
- Page 186:
Section GPipeline
- Page 190:
Chapter 3Transportation andthe Econ
- Page 193 and 194:
Table 3-2: U.S. Gross Domestic Prod
- Page 195 and 196:
Table 3-4: U.S. Gross Domestic Prod
- Page 197 and 198:
Table 3-6: U.S. Gross Domestic Dema
- Page 199 and 200:
Table 3-8: Contributions to Gross D
- Page 201 and 202:
Table 3-10: National Transportation
- Page 204 and 205:
Table 3-11: Sales Price of Transpor
- Page 206 and 207:
Table 3-13: Producer Price Indices
- Page 208 and 209:
Table 3-15: Personal Expenditures b
- Page 210 and 211:
Table 3-17: Average Cost of Owning
- Page 212:
Table 3-19: Average Passenger Fares
- Page 216 and 217:
Table 3-20: Average Passenger Reven
- Page 218 and 219:
Table 3-22: Total Operating Revenue
- Page 220 and 221:
Table 3-24: Employment in Transport
- Page 222 and 223:
Table 3-26: Median Weekly Earnings
- Page 224:
Table 3-28: Labor Productivity Indi
- Page 228 and 229:
Table 3-29: Federal, State, and Loc
- Page 230 and 231:
Table 3-31: Summary of Transportati
- Page 232 and 233:
Table 3-33: Transportation Revenues
- Page 234 and 235:
Table 3-35: Transportation Expendit
- Page 236 and 237:
Table 3-37: Federal Transportation
- Page 239:
Chapter 4Transportation, Energy,and
- Page 242 and 243:
Table 4-2: U.S. Consumption of Ener
- Page 245:
Section BTransportation EnergyConsu
- Page 248 and 249:
Table 4-5: Fuel Consumption by Mode
- Page 250 and 251:
Table 4-7: Domestic Demand for Gaso
- Page 252 and 253:
Table 4-9: Motor Vehicle Fuel Consu
- Page 254 and 255:
Table 4-11: Light Duty Vehicle, Sho
- Page 256 and 257:
Table 4-13: Single-Unit 2-Axle 6-Ti
- Page 258 and 259:
Table 4-15: Bus Fuel Consumption an
- Page 260 and 261:
Table 4-17: Class I Rail Freight Fu
- Page 262 and 263:
Table 4-19: U.S. Government Energy
- Page 265 and 266:
Table 4-20: Energy Intensity of Pas
- Page 267 and 268:
Table 4-22: Energy Intensity of Lig
- Page 269 and 270:
Table 4-24: Energy Intensity of Tra
- Page 271 and 272:
Table 4-26: Energy Intensity of Amt
- Page 273 and 274:
Table 4-28: Annual Wasted Fuel Due
- Page 275 and 276:
Table 4-29: Annual Wasted Fuel Per
- Page 278:
Section DAir Pollution
- Page 281 and 282:
Table 4-31: Federal Exhaust Emissio
- Page 283 and 284:
1968-Table 4-33: Federal Exhaust Em
- Page 285 and 286:
Table 4-35: Federal Exhaust Emissio
- Page 287 and 288:
KEY: CO = carbon monoxide; HC = hyd
- Page 289 and 290:
Table 4-38: Federal Exhaust Emissio
- Page 291 and 292:
KEY: CO = carbon monoxide; g = gram
- Page 293 and 294:
KEY: bhp = brake horsepower; bhph =
- Page 295 and 296:
Table 4-42: Tier 2 Federal Exhaust
- Page 297 and 298:
Table 4-44: Estimated National Aver
- Page 299 and 300:
Table 4-46: Estimated National Emis
- Page 301 and 302:
Table 4-48: Estimated National Emis
- Page 303 and 304:
Table 4-50: Estimated National Emis
- Page 305 and 306:
Monmouth-Ocean, NJ 5 21 4 41 34 31
- Page 307 and 308:
Table 4-52: Areas in Nonattainment
- Page 310:
Section EWater Pollution, Noise,and
- Page 313 and 314:
Table 4-55: Leaking Underground Sto
- Page 315 and 316:
Table 4-57: Number of People Residi
- Page 318:
appendix aMetric ConversionTables
- Page 321 and 322:
Table 1-4M: Kilometers of Public Ro
- Page 323 and 324:
Table 1-35M: U.S. Vehicle-Kilometer
- Page 325 and 326:
Table 1-38M: Average Length of Haul
- Page 327 and 328:
a Includes freight, express, and ma
- Page 329 and 330:
Table 1-56M: U.S. Waterborne Freigh
- Page 331 and 332:
Table 4-3M: Domestic Demand for Ref
- Page 333 and 334:
Table 4-6M: Energy Consumption by M
- Page 335 and 336:
Table 4-8M: Certificated Air Carrie
- Page 337 and 338:
Table 4-11M: Light Duty Vehicle, Sh
- Page 339 and 340:
Table 4-13M: Single-Unit 2-Axle 6-T
- Page 341 and 342:
Table 4-15M: Bus Fuel Consumption a
- Page 343 and 344:
Table 4-17M: Class I Rail Freight F
- Page 345 and 346:
Table 4-19M: U.S. Government Energy
- Page 347 and 348:
Table 4-21M: Energy Intensity of Ce
- Page 349 and 350:
Table 4-23M: Average Fuel Efficienc
- Page 351 and 352:
Table 4-25M: Energy Intensity of Cl
- Page 353 and 354:
Appendix B: GlossaryAIR CARRIER: A
- Page 355 and 356:
Appendix B: GlossaryCOLLISION WITH
- Page 357 and 358:
Appendix B: GlossaryFEDERAL ENERGY
- Page 359 and 360:
Appendix B: GlossaryINJURY (Rail):
- Page 361 and 362:
Appendix B: GlossaryMOTOR BUS (Tran
- Page 363 and 364:
Appendix B: GlossaryPERSONAL BUSINE
- Page 365 and 366:
Appendix B: GlossarySUBCOMPACT CAR:
- Page 367 and 368:
appendix cAcronyms and InitialismsA
- Page 370:
appendix dModal Profiles
- Page 373 and 374:
Air Carrier Profile continuedPerfor
- Page 375 and 376:
Air Carrier Profile continuedPerfor
- Page 377 and 378:
Highway ProfileFINANCIAL 1960 1970
- Page 379 and 380:
General Aviation ProfileINVENTORY 1
- Page 381 and 382:
Motorcycle f f f f 50 50 50 50 50 5
- Page 383 and 384:
KEY: R = revised; U = data are unav
- Page 385 and 386:
Transit ProfileFINANCIAL 1960 1970
- Page 387 and 388:
161960-2006: Fatalities and Injured
- Page 389 and 390:
SAFETY d,9Number of fatalities, rai
- Page 391 and 392:
SAFETYFatalities in waterborne tran
- Page 393 and 394:
Natural Gas Pipeline ProfileFINANCI
- Page 395:
appendix eSource andAccuracy Statem
- Page 398 and 399:
agencies receiving funds through th
- Page 400 and 401:
solicitations of all federally regu
- Page 402 and 403:
Passenger Car, Truck, Bus, and Recr
- Page 404 and 405:
Highway, Total (registered vehicles
- Page 406 and 407:
after 1996. Some jurisdictions fail
- Page 408 and 409:
adherence to federal guidelines reg
- Page 410 and 411:
year. Also, expansion factors are u
- Page 412 and 413:
PassengerAir CarrierThe U.S. Depart
- Page 414 and 415:
The data are from Waterborne Commer
- Page 416 and 417:
The Transborder Surface Freight Dat
- Page 418 and 419:
A second data source for air-carrie
- Page 420 and 421:
Appendix EData Source and Accuracy
- Page 422 and 423:
when data are entered, they are che
- Page 424 and 425:
vehicles, and 15 were deleted becau
- Page 426 and 427:
TABLE 2-4. Distribution of Transpor
- Page 428 and 429:
BEA personal consumption expenditur
- Page 430 and 431:
Transportation-related government p
- Page 432 and 433:
information on their data collectio
- Page 434 and 435:
AccuracyAs in all surveys, the accu
- Page 436 and 437:
The American Public Transit Associa
- Page 438 and 439:
Government EmploymentThe Office of
- Page 440 and 441:
specifications or equations, should
- Page 442 and 443:
As mentioned above, the Highway Rev
- Page 444 and 445:
Highway ExpendituresFederal Highway
- Page 446 and 447:
consistency between the different m
- Page 448 and 449:
Appendix EData Source and Accuracy
- Page 450 and 451:
when data are entered, they are che
- Page 452 and 453:
vehicles, and 15 were deleted becau
- Page 454 and 455:
TABLE 2-4. Distribution of Transpor
- Page 456 and 457:
agencies receiving funds through th
- Page 458 and 459:
solicitations of all federally regu
- Page 460 and 461:
Passenger Car, Truck, Bus, and Recr
- Page 462 and 463:
Highway, Total (registered vehicles
- Page 464 and 465:
after 1996. Some jurisdictions fail
- Page 466 and 467:
adherence to federal guidelines reg
- Page 468 and 469:
year. Also, expansion factors are u
- Page 470 and 471:
PassengerAir CarrierThe U.S. Depart
- Page 472 and 473:
The data are from Waterborne Commer
- Page 474 and 475:
The Transborder Surface Freight Dat
- Page 476 and 477:
A second data source for air-carrie
- Page 478 and 479:
Appendix EData Source and Accuracy
- Page 480 and 481:
If transportation had been reviewed
- Page 482 and 483:
Alternative FuelsIn addition to oxy
- Page 484 and 485:
RailThe data are from Railroad Fact
- Page 486 and 487:
multiplied by the average peak peri
- Page 488 and 489:
In general, lead emissions are esti
- Page 490 and 491:
The number of the people exposed to
- Page 492 and 493:
Appendix EData Source and Accuracy
- Page 494 and 495:
If transportation had been reviewed
- Page 496 and 497:
Alternative FuelsIn addition to oxy
- Page 498 and 499:
RailThe data are from Railroad Fact
- Page 500 and 501:
multiplied by the average peak peri
- Page 502 and 503:
In general, lead emissions are esti
- Page 504 and 505:
The number of the people exposed to