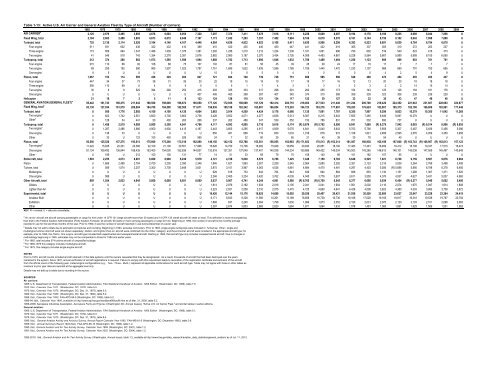
Table 1-13: Active U.S. Air Carrier and General Aviation Fleet by Type <strong>of</strong> Aircraft (Number <strong>of</strong> carriers)1965 1970 1975 1980 1985 1990 1991 1992 1993 1994 1995 1996 1997 1998 1999 2000 2001 2002 2003 2004 2005 2006 2007 2008 2009AIR CARRIER a 2,125 2,679 2,495 3,805 4,678 6,083 6,054 7,320 7,297 7,370 7,411 7,478 7,616 8,111 8,228 8,049 8,497 8,194 8,176 8,186 8,225 8,089 8,044 7,856 UFixed Wing, total 2,104 2,663 2,488 3,803 4,673 6,072 6,048 7,187 7,173 7,242 7,293 7,357 7,482 7,994 8,106 8,010 8,370 8,161 8,144 8,150 8,182 8,042 7,998 7,808 UTurbojet, total 725 2,136 2,114 2,526 3,164 4,148 4,167 4,446 4,584 4,636 4,832 4,922 5,108 5,411 5,630 5,956 6,296 6,383 6,523 6,691 6,839 6,784 6,784 6,670 UFour engine 511 931 602 436 322 432 410 389 410 420 435 440 450 447 441 432 419 365 337 305 310 272 263 237 UThree engine 173 659 994 1,347 1,488 1,438 1,376 1,381 1,292 1,236 1,210 1,212 1,224 1,238 1,181 1,061 996 790 602 519 540 523 416 373 UTwo engine 41 546 518 743 1,354 2,278 2,381 2,676 2,882 2,980 3,187 3,270 3,434 3,726 4,008 4,463 4,881 5,228 5,584 5,867 5,989 5,989 6,105 6,060 UTurboprop, total 312 374 260 682 1,073 1,595 1,598 1,894 1,868 1,782 1,713 1,696 1,646 1,832 1,788 1,469 1,494 1,250 1,123 989 889 803 761 701 UFour engine 215 110 68 92 108 88 75 107 102 87 81 56 45 39 28 29 24 17 16 17 7 7 7 7 UTwo engine 89 259 192 590 965 1,507 1,523 1,787 1,751 1,695 1,632 1,635 1,596 1,789 1,759 1,440 1,470 1,233 1,107 968 880 791 750 685 UOne engine 8 5 U U U U U U 15 0 0 5 5 4 1 0 0 0 0 4 2 5 4 9 UPiston, total 1,067 153 114 595 436 329 283 847 721 824 748 739 728 751 688 585 580 528 498 470 454 455 453 437 UFour engine 447 34 37 73 38 31 26 20 22 19 15 18 19 17 19 17 16 12 13 20 20 18 18 18 UThree engine 590 110 69 U 4 6 5 5 0 5 1 7 4 3 3 3 3 3 3 2 2 14 15 14 UTwo engine 30 9 8 522 394 292 252 415 293 335 333 317 298 391 292 255 173 154 143 125 126 184 181 176 UOne engine U U U U U U U 407 406 465 399 397 407 340 374 310 388 359 339 323 306 239 239 229 UHelicopter 21 16 7 2 5 11 6 133 124 128 118 121 134 117 122 39 127 33 32 36 43 47 46 48 UGENERAL AVIATION (GENERAL FLEET) b 95,442 161,743 168,475 211,043 196,500 198,000 196,874 185,650 177,120 172,935 188,089 191,129 192,414 204,710 219,464 217,533 211,446 211,244 209,708 219,426 224,352 221,943 231,607 228,663 223,877Fixed Wing, total c 93,130 127,934 161,570 200,094 184,700 184,500 182,585 171,671 156,936 150,158 162,342 163,691 166,854 175,203 184,723 183,276 177,697 176,283 176,624 182,867 185,373 182,186 186,806 182,961 177,446Turbojet, total U 950 1,776 2,992 4,100 4,100 4,126 4,004 3,663 3,914 4,559 4,424 5,178 6,066 7,120 7,001 7,787 8,355 7,997 9,298 9,823 10,379 10,385 11,042 11,268Two engine d U 822 1,742 2,551 3,600 3,700 3,863 3,738 3,426 3,652 4,071 4,077 4,638 5,513 6,387 6,215 5,643 7,655 7,465 8,649 9,097 10,379 U U UOther e U 128 34 441 50 400 263 266 237 262 488 347 539 552 733 786 831 701 532 650 727 U U U UTurboprop, total U 1,458 2,519 4,089 5,000 5,300 4,941 4,786 4,117 4,093 4,995 5,716 5,618 6,174 (R) 5,679 (R) 5,762 6,596 6,841 7,689 (R) 8,379 7,942 8,063 (R) 9,514 8,906 (R) 9,055Two engine d U 1,287 2,486 3,966 4,900 4,900 4,415 4,187 3,443 3,605 4,295 4,917 4,939 5,076 4,641 5,040 5,643 5,703 5,790 5,858 5,307 5,487 5,456 5,456 5,096One engine U 138 33 U U U U U 650 481 668 719 650 1,033 1,018 678 915 1,108 1,821 2,468 2,595 2,576 4,059 3,450 3,958Other U 33 U 123 100 400 526 599 24 7 32 80 29 65 21 45 38 30 78 54 40 U U U UPiston, total 92,556 125,526 157,275 193,013 175,600 175,200 173,518 162,880 149,156 142,152 152,788 153,551 156,055 162,963 (R) 171,923 170,513 (R) 163,314 161,087 160,938 165,189 167,608 (R) 163,743 (R) 166,907 (R) 163,013 157,123Two engine d 11,422 15,835 20,331 24,366 22,100 21,100 20,551 17,966 15,626 14,750 15,706 16,082 15,938 18,659 20,930 20,951 18,192 17,483 17,491 18,469 19,412 18,708 19,337 17,515 16,474One engine 81,134 109,492 136,944 168,435 153,400 154,000 152,836 144,837 133,516 127,351 137,049 137,401 140,038 144,234 150,886 149,422 145,034 143,503 143,265 146,613 148,101 145,036 147,569 145,497 140,649Other U 199 U 212 100 100 131 77 14 51 33 68 79 70 108 140 89 101 182 107 95 U U U URotorcraft, total 1,503 2,255 4,073 6,001 6,000 6,900 6,238 5,979 4,721 4,728 5,830 6,570 6,786 7,425 7,448 7,150 6,783 6,648 6,525 7,821 8,728 9,159 9,567 9,876 9,984Piston U 1,666 2,499 2,794 2,700 3,200 2,390 2,348 1,846 1,627 1,863 2,507 2,259 2,545 2,564 2,680 2,292 2,351 2,123 2,315 3,039 3,264 2,769 3,498 3,499Turbine, total U 589 1,574 3,207 3,300 3,700 3,848 3,631 2,875 3,101 3,967 4,063 4,526 4,881 4,884 4,470 4,491 4,297 4,403 5,506 (R) 5,688 5,895 6,798 6,378 6,485Multiengine U U U U U U U U 629 616 733 643 764 843 839 694 884 686 853 1,130 1,151 1,268 1,367 1,371 1,520One engine U 589 U U U U U U 2,246 2,485 3,234 3,420 3,762 4,038 4,045 3,776 3,607 3,611 3,550 4,376 4,537 4,627 5,431 5,007 4,965Other Aircraft, total 809 1,554 2,832 4,945 5,800 6,600 8,051 8,000 5,037 5,907 4,741 4,244 4,091 5,580 (R) 6,765 (R) 6,700 6,545 6,377 6,008 5,939 6,454 (R) 6,277 5,940 5,652 5,480Gliders U U U U U U U U 1,814 2,976 2,182 1,934 2,016 2,105 2,041 2,041 1,904 1,951 2,002 2,116 2,074 1,975 1,947 1,914 1,808Lighter-than-Air U U U U U U U U 3,223 2,931 2,559 2,310 2,075 3,475 4,725 4,660 4,641 4,426 4,006 3,823 4,380 4,303 3,993 3,738 3,672Experimental, total U U U U U U U U 10,426 12,144 15,176 16,625 14,680 16,502 20,528 20,407 20,421 21,936 20,550 22,800 23,627 23,047 23,228 23,364 24,419Amateur Built U U U U U U U U 6,171 8,833 9,328 11,566 10,261 13,189 16,858 16,739 16,736 18,168 17,028 19,165 19,817 19,316 19,538 19,767 20,794Exhibition U U U U U U U U 1,868 637 2,245 2,094 1,798 1,630 1,999 1,973 2,052 2,190 2,031 2,070 2,120 2,103 2,101 2,096 2,063Other U U U U U U U U 2,387 2,674 3,603 2,965 2,620 1,684 1,671 1,694 1,633 1,578 1,491 1,565 1,691 1,629 1,589 1,501 1,562KEY: R = revised; U = data are unavailable.aAir carrier aircraft are aircraft carrying passengers or cargo for hire under 14 CFR 121 (large aircraft-more than 30 seats) and 14 CFR 135 (small aircraft-30 seats or less). This definition is more encompassingthan that in the Federal Aviation Administration (FAA) Aviation Forecast- jet aircraft, 60 seats or more carrying passengers or cargo for hire. Beginning in 1990, the number <strong>of</strong> aircraft is the monthly averagereported in use for the last three months <strong>of</strong> the year. Prior to 1990, it was the number <strong>of</strong> aircraft reported in use during December <strong>of</strong> a given year.bDetails may not add to totals due to estimation procedures and rounding. Beginning in 1993, excludes commuters. Prior to 1993, single-engine turboprops were included in Turboprop, Other ; single andmultiengine turbine rotorcraft were not shown separately; Gliders and Lighter-than-air aircraft were combined into the Other category; and Experimental aircraft were included in the appropriate aircraft type; forexample, prior to 1993, the Piston, One engine aircraft type included both experimental and nonexperimental aircraft. Starting in 1993, that aircraft type only includes nonexperimental aircraft. Due to changes inmethodology beginning in 1995, estimates may not be comparable to those for 1994 and earlier years.c For 1965, total includes 574 turbine aircraft <strong>of</strong> unspecified subtype.d For 1965-1975 this category includes multiengine aircraft.e For 1975, this category includes single-engine aircraft.NOTESPrior to 1970, aircraft counts included aircraft retained in FAA data systems until the owners requested that they be deregistered. As a result, thousands <strong>of</strong> aircraft that had been destroyed over the yearsremained in the system. Since 1970, annual verification <strong>of</strong> aircraft registrations is required. Failure to comply with this requirement leads to revocation <strong>of</strong> the registration certificate and exclusion <strong>of</strong> the aircraftfrom the <strong>of</strong>ficial count <strong>of</strong> the following year. Listed engine configurations (e.g., Two-, Three-, Multi- ) represent all applicable combinations for each aircraft type. Totals may not agree with those in other tables asrevisions to prior year data are reported at the aggregate level only.Details may not add up to totals due to rounding in the source.SOURCESAir carriers:1965: U.S. <strong>Department</strong> <strong>of</strong> <strong>Transportation</strong>, Federal Aviation Administration, FAA Statistical Handbook <strong>of</strong> Aviation, 1966 Edition. (Washington, DC: 1966), table 7.5.1970: Ibid., Calendar Year 1971. (Washington, DC: 1972), table 5.5.1975: Ibid., Calendar Year 1975. (Washington, DC: Dec. 31, 1975), table 5.3.1980: Ibid., Calendar Year 1980. (Washington, DC: Dec. 31, 1980), table 5.2.1985: Ibid., Calendar Year 1993. FAA-APO-95-5 (Washington, DC: 1995), table 5.2.1990-94: Ibid., Calendar Year 1996, available at http://www.api.faa.gov/handbook96/toc96.htm as <strong>of</strong> Mar. 31, 2000, table 5.2.1995-2008: Aerospace Industries Association, Aerospace Facts and Figures (Washington DC: Annual Issues), "Active U.S. Air Carrier Fleet," and similar tables in earlier editions.General aviation:1965: U.S. <strong>Department</strong> <strong>of</strong> <strong>Transportation</strong>, Federal Aviation Administration, FAA Statistical Handbook <strong>of</strong> Aviation, 1966 Edition. (Washington, DC: 1966), table 5.1.1970: Ibid., Calendar Year 1971. (Washington, DC: 1972), table 8.3.1975: Ibid., Calendar Year 1975. (Washington, DC: Dec. 31, 1975), table 8.4.1980: Ibid., General Aviation Activity and Avionics Survey, Annual Report Calendar Year 1980, FAA-MS-81-5 (Washington, DC: December 1985), table 2-6.1985: Ibid., Annual Summary Report 1994 Data, FAA-APO-95-10 (Washington, DC: 1996), table 1.2.1990: Ibid., General Aviation and Air Taxi Activity Survey, Calendar Year 1999 (Washington, DC: 2001), table 1.2.1991: Ibid., General Aviation and Air Taxi Activity Survey, Calendar Year 2002 (Washington, DC: 2004), table 1.2.1992-2010: lbid., General Aviation and Air Taxi Activity Survey (Washington, Annual Issue), table 1.2, available at http://www.faa.gov/data_research/aviation_data_statistics/general_aviation/ as <strong>of</strong> Jul. 11, 2012.
Table 1-14: U.S. Automobile and Truck Fleets by Use (Thousands)1990 1991 1992 1993 1994 1995 1996 1997 1998 1999 2000 2001 e 2002 e 2003 e 2004 e 2005 e 2006 e 2007 e 2008 e 2009 e 2010 eTOTAL automobiles and trucks in fleets U U U U U 15,257 15,570 15,869 16,879 15,530 15,196 13,642 11,985 12,128 11,884 12,274 12,538 12,132 11,211 10,865 11,550Automobiles in fleets, total U U U U U 9,042 9,124 9,225 9,550 7,742 7,346 6,640 5,600 5,647 5,514 5,621 5,662 5,441 4,882 4,804 5,291Automobiles in fleets <strong>of</strong> 25 or more (10 or more cars for 1999-2001 and 15 ormore cars for 2002-10) aBusiness b 2,889 2,628 2,492 1,751 1,722 1,326 1,295 1,188 1,159 3,195 2,950 2,620 930 929 873 877 927 891 791 741 804Government c 538 504 516 401 428 1,214 1,209 1,218 1,030 885 883 734 1,360 1,420 1,200 1,200 1,237 1,263 1,299 1,352 1,330Utilities 551 544 548 386 382 376 376 377 359 320 317 U f U f U f U f U f U f U f U f U f U fPolice 249 250 264 264 266 269 274 280 289 302 306 312 317 317 402 412 414 420 432 417 424Taxi (includes vans) 141 141 140 140 141 139 130 181 190 135 136 142 148 148 156 162 169 172 175 159 155Rental (includes vans and SUVs) 990 1,160 1,448 1,501 1,473 1,518 1,590 1,608 1,602 1,733 1,581 1,542 1,555 1,520 1,570 1,620 1,595 1,440 1,289 1,175 1,553Automobiles in fleets <strong>of</strong> 4 to 24 (4 to 9 cars for 1999-2001 and 5 to 14 cars for2002-10) a U U U U U 4,200 4,250 4,373 4,921 1,172 1,173 1,290 1,290 1,313 1,313 1,350 1,320 1,255 896 960 1,025Trucks in fleets, total U U U U U 6,215 6,446 6,644 7,329 7,788 7,850 7,002 6,385 6,481 6,370 6,653 6,876 6,691 6,329 6,061 6,259Trucks in fleets <strong>of</strong> 25 or more (10 or more trucks for 1999-2001 and 15 or morecars for 2002-10) aBusiness d U U 1,080 1,378 1,375 1,205 1,275 1,332 1,360 3,016 3,026 2,820 2,180 2,181 2,337 2,370 2,411 2,306 2,224 1,999 2,136Government c U U 297 632 646 2,221 2,215 2,223 2,010 2,400 2,408 2,052 2,070 2,102 1,615 1,615 1,673 1,704 1,701 1,751 1,684Utilities U U 593 493 487 480 482 483 459 499 498 U f U f U f U f U f U f U f U f U f U fOther (police, taxi, etc.) U U 7 7 7 7 7 7 8 8 8 9 9 9 26 37 49 46 59 55 58Rental trucks (not including vans and SUVs) U U 304 308 363 202 197 179 181 213 248 246 251 289 492 521 540 490 381 380 391Trucks in fleets <strong>of</strong> 4 to 24 (4 to 9 trucks for 1999-2001 and 5 to 14 cars from2002-10) a U U U U U 2,100 2,270 2,420 3,311 1,652 1,662 1,875 1,875 1,900 1,900 2,110 2,203 2,145 1,964 1,875 1,990KEY: SUV = sport utility vehicle; U = data are not available.a The data source, Bobit Publishing, changed data collection categories in 1999 and again in 2002.bIncludes driver schools.cIncludes military vehicles and federal, state, county, and local government vehicles.dBusinesses with Class 1-5 trucks may include leasing, construction, plumbing, heating, food distribution, pest control,cable TV, etc.e2001-2010 data do not include employee-owned fleet information as the source has stopped publishing the data.f Business and utility data have been combined in the 2002 to 2010 issues <strong>of</strong> the Automotive Fleet Fact Book.SOURCEBobit Publishing Co., Automotive Fleet Fact Book, annual issues.
- Page 1: NationalTransportationStatistics
- Page 4 and 5: AcknowledgmentsU.S. Department of T
- Page 7 and 8: Table of ContentsINTRODUCTIONTable
- Page 9 and 10: 1-56 U.S. Waterborne Freight (Updat
- Page 11 and 12: SECTION E. RAILROAD2-39 Railroad an
- Page 13 and 14: 3-35 Transportation Expenditures by
- Page 15 and 16: 4-51 Air Pollution Trends in Select
- Page 18: IntroductionCompiled and published
- Page 21: SOURCESU.S. resident population, ag
- Page 25 and 26: Table 1-1: System Mileage Within th
- Page 27 and 28: Table 1-3: Number of U.S. Airports
- Page 29 and 30: Table 1-5: U.S. Public Road and Str
- Page 31 and 32: Table 1-7: Number of Stations Serve
- Page 33 and 34: Table 1-9: ADA-Accessible Rail Tran
- Page 36: Section BVehicle, Aircraft, andVess
- Page 39: Table 1-12: U.S. Sales or Deliverie
- Page 43 and 44: Table 1-16: Retail a New Passenger
- Page 45 and 46: Table 1-18: Retail Sales of New Car
- Page 47 and 48: Table 1-20: Period Sales, Market Sh
- Page 49 and 50: Table 1-22: Number of Trucks by Wei
- Page 51 and 52: Taiwan U U U 116 132 124 101 113 11
- Page 53: Section CCondition
- Page 56 and 57: Table 1-26: Average Age of Automobi
- Page 58 and 59: Table 1-28: Condition of U.S. Highw
- Page 60 and 61: Table 1-30: Condition of Urban Bus
- Page 62 and 63: Table 1-32: Class I Railroad Locomo
- Page 64 and 65: Table 1-34: U.S. Flag Vessels by Ty
- Page 66 and 67: Table 1-36: Roadway Vehicle-Miles T
- Page 68 and 69: Table 1-38: Average Length of Haul,
- Page 70 and 71: Table 1-40: U.S. Passenger-Miles (M
- Page 72 and 73: Table 1-42: Long-Distance Travel in
- Page 74 and 75: Table 1-43: Long-Distance Travel in
- Page 76 and 77: Table 1-45: Air Passenger Travel Ar
- Page 79: Section DTravel and GoodsMovement
- Page 82 and 83: Table 1-48: U.S.-Mexican Border Lan
- Page 84 and 85: Table 1-50: U.S. Ton-Miles of Freig
- Page 86 and 87: Table 1-52: U.S.-Canadian Border La
- Page 88 and 89: Table 1-54: U.S.-Mexican Border Lan
- Page 90 and 91:
Table 1-56: U.S. Waterborne Freight
- Page 92 and 93:
Table 1-58: Freight Activity in the
- Page 94 and 95:
Table 1-60: Value of U.S. Land Expo
- Page 96 and 97:
Table 1-61M: Crude Oil and Petroleu
- Page 98:
Table 1-63: U.S. Hazardous Material
- Page 102 and 103:
Table 1-64: Passengers Boarded and
- Page 104 and 105:
Table 1-66: Flight Operations Arriv
- Page 106 and 107:
Table 1-68: Major U.S. Air Carrier
- Page 108 and 109:
Table 1-69: Annual Person-Hours of
- Page 110 and 111:
Table 1-70: Travel Time IndexShort-
- Page 112 and 113:
Table 1-71: Annual Roadway Congesti
- Page 114:
Table 1-73: Amtrak On-Time Performa
- Page 118 and 119:
Table 2-1: Transportation Fatalitie
- Page 120 and 121:
Table 2-3: Transportation Accidents
- Page 122 and 123:
Table 2-5: Highway-Rail Grade-Cross
- Page 124 and 125:
Table 2-7: Transportation-Related O
- Page 127:
Section BAir
- Page 130 and 131:
Table 2-10: U.S. Commuter Air Carri
- Page 132 and 133:
Table 2-12: U.S. Commuter Air Carri
- Page 134 and 135:
Table 2-14: U.S. General Aviation a
- Page 136 and 137:
Table 2-16b: Prohibited Items Inter
- Page 139:
Section CHighway
- Page 142 and 143:
Table 2-18: Motor Vehicle Fatalitie
- Page 144 and 145:
Table 2-20: Occupant and Nonmotoris
- Page 146 and 147:
Table 2-22: Motorcycle Rider Safety
- Page 148 and 149:
Table 2-24: Bus Occupant Safety Dat
- Page 150 and 151:
Table 2-26: Fatalities by Highest B
- Page 152 and 153:
Table 2-28: Motor Vehicle Fatal Cra
- Page 154 and 155:
Table 2-30: Safety Belt and Motorcy
- Page 157:
Section DTransit
- Page 160 and 161:
Table 2-33: Transit Safety Data by
- Page 162 and 163:
d The number of Unlinked passenger
- Page 164 and 165:
Table 2-36: Transit and Grade-Cross
- Page 166 and 167:
Table 2-38: Reports of Violent Crim
- Page 168:
KEY: N = data do not exist.a The ki
- Page 172 and 173:
Table 2-39: Railroad and Grade-Cros
- Page 174 and 175:
Table 2-41: Train Fatalities, Injur
- Page 176 and 177:
Table 2-43: Railroad System Safety
- Page 178:
Section FWater
- Page 181 and 182:
Table 2-46: Waterborne Transportati
- Page 183 and 184:
Table 2-48: Personal Watercraft Saf
- Page 186:
Section GPipeline
- Page 190:
Chapter 3Transportation andthe Econ
- Page 193 and 194:
Table 3-2: U.S. Gross Domestic Prod
- Page 195 and 196:
Table 3-4: U.S. Gross Domestic Prod
- Page 197 and 198:
Table 3-6: U.S. Gross Domestic Dema
- Page 199 and 200:
Table 3-8: Contributions to Gross D
- Page 201 and 202:
Table 3-10: National Transportation
- Page 204 and 205:
Table 3-11: Sales Price of Transpor
- Page 206 and 207:
Table 3-13: Producer Price Indices
- Page 208 and 209:
Table 3-15: Personal Expenditures b
- Page 210 and 211:
Table 3-17: Average Cost of Owning
- Page 212:
Table 3-19: Average Passenger Fares
- Page 216 and 217:
Table 3-20: Average Passenger Reven
- Page 218 and 219:
Table 3-22: Total Operating Revenue
- Page 220 and 221:
Table 3-24: Employment in Transport
- Page 222 and 223:
Table 3-26: Median Weekly Earnings
- Page 224:
Table 3-28: Labor Productivity Indi
- Page 228 and 229:
Table 3-29: Federal, State, and Loc
- Page 230 and 231:
Table 3-31: Summary of Transportati
- Page 232 and 233:
Table 3-33: Transportation Revenues
- Page 234 and 235:
Table 3-35: Transportation Expendit
- Page 236 and 237:
Table 3-37: Federal Transportation
- Page 239:
Chapter 4Transportation, Energy,and
- Page 242 and 243:
Table 4-2: U.S. Consumption of Ener
- Page 245:
Section BTransportation EnergyConsu
- Page 248 and 249:
Table 4-5: Fuel Consumption by Mode
- Page 250 and 251:
Table 4-7: Domestic Demand for Gaso
- Page 252 and 253:
Table 4-9: Motor Vehicle Fuel Consu
- Page 254 and 255:
Table 4-11: Light Duty Vehicle, Sho
- Page 256 and 257:
Table 4-13: Single-Unit 2-Axle 6-Ti
- Page 258 and 259:
Table 4-15: Bus Fuel Consumption an
- Page 260 and 261:
Table 4-17: Class I Rail Freight Fu
- Page 262 and 263:
Table 4-19: U.S. Government Energy
- Page 265 and 266:
Table 4-20: Energy Intensity of Pas
- Page 267 and 268:
Table 4-22: Energy Intensity of Lig
- Page 269 and 270:
Table 4-24: Energy Intensity of Tra
- Page 271 and 272:
Table 4-26: Energy Intensity of Amt
- Page 273 and 274:
Table 4-28: Annual Wasted Fuel Due
- Page 275 and 276:
Table 4-29: Annual Wasted Fuel Per
- Page 278:
Section DAir Pollution
- Page 281 and 282:
Table 4-31: Federal Exhaust Emissio
- Page 283 and 284:
1968-Table 4-33: Federal Exhaust Em
- Page 285 and 286:
Table 4-35: Federal Exhaust Emissio
- Page 287 and 288:
KEY: CO = carbon monoxide; HC = hyd
- Page 289 and 290:
Table 4-38: Federal Exhaust Emissio
- Page 291 and 292:
KEY: CO = carbon monoxide; g = gram
- Page 293 and 294:
KEY: bhp = brake horsepower; bhph =
- Page 295 and 296:
Table 4-42: Tier 2 Federal Exhaust
- Page 297 and 298:
Table 4-44: Estimated National Aver
- Page 299 and 300:
Table 4-46: Estimated National Emis
- Page 301 and 302:
Table 4-48: Estimated National Emis
- Page 303 and 304:
Table 4-50: Estimated National Emis
- Page 305 and 306:
Monmouth-Ocean, NJ 5 21 4 41 34 31
- Page 307 and 308:
Table 4-52: Areas in Nonattainment
- Page 310:
Section EWater Pollution, Noise,and
- Page 313 and 314:
Table 4-55: Leaking Underground Sto
- Page 315 and 316:
Table 4-57: Number of People Residi
- Page 318:
appendix aMetric ConversionTables
- Page 321 and 322:
Table 1-4M: Kilometers of Public Ro
- Page 323 and 324:
Table 1-35M: U.S. Vehicle-Kilometer
- Page 325 and 326:
Table 1-38M: Average Length of Haul
- Page 327 and 328:
a Includes freight, express, and ma
- Page 329 and 330:
Table 1-56M: U.S. Waterborne Freigh
- Page 331 and 332:
Table 4-3M: Domestic Demand for Ref
- Page 333 and 334:
Table 4-6M: Energy Consumption by M
- Page 335 and 336:
Table 4-8M: Certificated Air Carrie
- Page 337 and 338:
Table 4-11M: Light Duty Vehicle, Sh
- Page 339 and 340:
Table 4-13M: Single-Unit 2-Axle 6-T
- Page 341 and 342:
Table 4-15M: Bus Fuel Consumption a
- Page 343 and 344:
Table 4-17M: Class I Rail Freight F
- Page 345 and 346:
Table 4-19M: U.S. Government Energy
- Page 347 and 348:
Table 4-21M: Energy Intensity of Ce
- Page 349 and 350:
Table 4-23M: Average Fuel Efficienc
- Page 351 and 352:
Table 4-25M: Energy Intensity of Cl
- Page 353 and 354:
Appendix B: GlossaryAIR CARRIER: A
- Page 355 and 356:
Appendix B: GlossaryCOLLISION WITH
- Page 357 and 358:
Appendix B: GlossaryFEDERAL ENERGY
- Page 359 and 360:
Appendix B: GlossaryINJURY (Rail):
- Page 361 and 362:
Appendix B: GlossaryMOTOR BUS (Tran
- Page 363 and 364:
Appendix B: GlossaryPERSONAL BUSINE
- Page 365 and 366:
Appendix B: GlossarySUBCOMPACT CAR:
- Page 367 and 368:
appendix cAcronyms and InitialismsA
- Page 370:
appendix dModal Profiles
- Page 373 and 374:
Air Carrier Profile continuedPerfor
- Page 375 and 376:
Air Carrier Profile continuedPerfor
- Page 377 and 378:
Highway ProfileFINANCIAL 1960 1970
- Page 379 and 380:
General Aviation ProfileINVENTORY 1
- Page 381 and 382:
Motorcycle f f f f 50 50 50 50 50 5
- Page 383 and 384:
KEY: R = revised; U = data are unav
- Page 385 and 386:
Transit ProfileFINANCIAL 1960 1970
- Page 387 and 388:
161960-2006: Fatalities and Injured
- Page 389 and 390:
SAFETY d,9Number of fatalities, rai
- Page 391 and 392:
SAFETYFatalities in waterborne tran
- Page 393 and 394:
Natural Gas Pipeline ProfileFINANCI
- Page 395:
appendix eSource andAccuracy Statem
- Page 398 and 399:
agencies receiving funds through th
- Page 400 and 401:
solicitations of all federally regu
- Page 402 and 403:
Passenger Car, Truck, Bus, and Recr
- Page 404 and 405:
Highway, Total (registered vehicles
- Page 406 and 407:
after 1996. Some jurisdictions fail
- Page 408 and 409:
adherence to federal guidelines reg
- Page 410 and 411:
year. Also, expansion factors are u
- Page 412 and 413:
PassengerAir CarrierThe U.S. Depart
- Page 414 and 415:
The data are from Waterborne Commer
- Page 416 and 417:
The Transborder Surface Freight Dat
- Page 418 and 419:
A second data source for air-carrie
- Page 420 and 421:
Appendix EData Source and Accuracy
- Page 422 and 423:
when data are entered, they are che
- Page 424 and 425:
vehicles, and 15 were deleted becau
- Page 426 and 427:
TABLE 2-4. Distribution of Transpor
- Page 428 and 429:
BEA personal consumption expenditur
- Page 430 and 431:
Transportation-related government p
- Page 432 and 433:
information on their data collectio
- Page 434 and 435:
AccuracyAs in all surveys, the accu
- Page 436 and 437:
The American Public Transit Associa
- Page 438 and 439:
Government EmploymentThe Office of
- Page 440 and 441:
specifications or equations, should
- Page 442 and 443:
As mentioned above, the Highway Rev
- Page 444 and 445:
Highway ExpendituresFederal Highway
- Page 446 and 447:
consistency between the different m
- Page 448 and 449:
Appendix EData Source and Accuracy
- Page 450 and 451:
when data are entered, they are che
- Page 452 and 453:
vehicles, and 15 were deleted becau
- Page 454 and 455:
TABLE 2-4. Distribution of Transpor
- Page 456 and 457:
agencies receiving funds through th
- Page 458 and 459:
solicitations of all federally regu
- Page 460 and 461:
Passenger Car, Truck, Bus, and Recr
- Page 462 and 463:
Highway, Total (registered vehicles
- Page 464 and 465:
after 1996. Some jurisdictions fail
- Page 466 and 467:
adherence to federal guidelines reg
- Page 468 and 469:
year. Also, expansion factors are u
- Page 470 and 471:
PassengerAir CarrierThe U.S. Depart
- Page 472 and 473:
The data are from Waterborne Commer
- Page 474 and 475:
The Transborder Surface Freight Dat
- Page 476 and 477:
A second data source for air-carrie
- Page 478 and 479:
Appendix EData Source and Accuracy
- Page 480 and 481:
If transportation had been reviewed
- Page 482 and 483:
Alternative FuelsIn addition to oxy
- Page 484 and 485:
RailThe data are from Railroad Fact
- Page 486 and 487:
multiplied by the average peak peri
- Page 488 and 489:
In general, lead emissions are esti
- Page 490 and 491:
The number of the people exposed to
- Page 492 and 493:
Appendix EData Source and Accuracy
- Page 494 and 495:
If transportation had been reviewed
- Page 496 and 497:
Alternative FuelsIn addition to oxy
- Page 498 and 499:
RailThe data are from Railroad Fact
- Page 500 and 501:
multiplied by the average peak peri
- Page 502 and 503:
In general, lead emissions are esti
- Page 504 and 505:
The number of the people exposed to