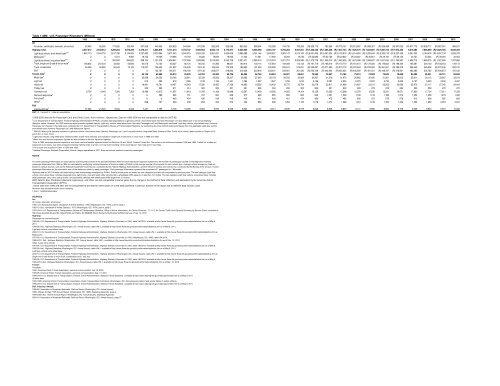
Table 1-40M: U.S. Passenger-Kilometers (Millions)1960 1965 1970 1975 1980 1985 1990 1991 1992 1993 1994 1995 1996 1997 1998 1999 2000 2001 2002 2003 2004 2005 2006 2007 2008 2009 2010AirAir carrier, certificated, domestic, all services 50,049 85,659 174,520 192,464 307,008 443,959 556,629 544,096 570,938 582,948 625,086 650,033 699,504 725,288 744,730 785,263 (R) 829,775 782,956 (R) 778,157 (R) 813,687 (R) 898,327 (R) 939,489 (R) 947,052 (R) 977,779 (R) 938,717 (R) 887,941 908,941Highway, total 2,047,212 2,502,912 3,286,284 3,870,399 4,270,411 4,848,878 5,731,210 5,794,157 5,950,903 6,064,114 6,175,877 6,225,055 6,386,498 6,581,197 6,760,265 6,927,051 (R) 7,323,440 (R) 7,385,358 (R) 7,547,724 (R) 7,629,479 (R) 7,833,881 (R) 7,887,734 (R) 7,974,402 8,016,285 7,886,060 (R) 6,825,785 6,830,309Light duty vehicle, short wheel base a,b,c 1,842,173 2,244,718 2,817,796 3,144,925 3,237,982 3,370,965 3,671,543 3,540,975 3,553,795 3,561,931 3,620,609 3,680,388 3,761,146 3,844,827 3,965,147 4,015,104 (R) 5,001,406 (R) 5,051,924 (R) 5,176,916 (R) 5,214,853 (R) 5,295,644 (R) 5,330,719 (R) 5,207,439 5,351,032 5,148,478 (R) 4,507,134 4,528,783Motorcycle b,c U U 5,274 9,965 19,725 19,009 19,995 18,759 19,226 19,609 19,940 17,344 17,561 17,846 18,203 18,736 (R) 24,885 (R) 22,729 (R) 22,832 (R) 23,267 (R) 30,607 (R) 28,150 (R) 39,154 43,731 42,534 (R) 36,094 32,003Light duty vehicle, long wheel base a,b,c U U 363,090 584,622 838,104 1,107,376 1,608,947 1,797,569 1,933,896 2,016,283 2,042,728 2,021,571 2,089,410 2,176,919 2,221,791 2,305,586 (R) 1,370,778 (R) 1,429,314 (R) 1,449,525 (R) 1,474,098 (R) 1,588,837 (R) 1,621,635 (R) 1,764,987 1,636,715 1,689,275 (R) 1,327,699 1,337,868Truck, single-unit 2-axle 6-tire or more d 158,602 207,234 43,583 55,693 64,073 73,130 83,527 85,131 86,702 91,366 98,627 100,914 103,114 107,654 109,469 113,143 (R) 161,716 (R) 166,519 (R) 172,710 (R) 181,410 (R) 179,020 (R) 176,602 (R) 198,460 193,087 204,153 (R) 193,454 178,112Truck, combination 46,436 50,960 56,543 75,195 110,527 125,630 151,827 155,535 160,146 165,949 175,309 185,800 191,349 200,499 206,574 213,051 (R) 259,487 (R) 271,930 (R) 270,719 (R) 279,284 (R) 278,352 (R) 281,841 (R) 285,370 296,440 295,839 (R) 270,530 283,102Bus e U U U U U 152,767 195,371 196,189 197,138 208,977 218,663 219,038 223,918 233,451 239,081 261,430 (R) 505,168 (R) 442,942 (R) 455,024 (R) 456,569 (R) 461,421 (R) 448,787 (R) 478,991 495,280 505,782 (R) 490,873 470,442Transit, total f U U U U 64,139 63,699 66,213 65,505 64,762 63,382 63,706 64,065 62,739 64,664 66,957 69,651 72,582 74,847 74,184 73,510 74,908 75,840 79,669 83,482 86,441 86,741 84,695Motor bus e U U U U 35,068 34,055 33,766 33,941 32,728 32,584 30,307 30,285 27,040 28,178 28,765 30,069 30,267 31,516 31,670 30,865 30,450 31,261 32,815 32,811 34,115 33,957 33,104Light rail U U U U 613 563 919 1,065 1,128 1,135 1,341 1,384 1,537 1,647 1,795 1,915 2,156 2,297 2,304 2,375 2,537 2,735 3,003 3,107 3,349 3,534 3,497Heavy rail U U U U 16,991 16,781 18,467 16,943 17,280 16,465 17,168 16,993 18,556 19,402 19,770 20,764 22,279 22,817 21,989 21,897 23,101 23,203 23,692 25,972 27,117 27,045 26,404Trolley bus U U U U 352 492 311 314 320 303 301 301 296 304 292 300 309 301 302 283 279 278 264 250 259 270 272Commuter rail 6,754 6,643 7,390 7,263 10,486 10,515 11,397 11,819 11,780 11,169 12,868 13,267 13,439 12,935 14,005 14,104 15,128 15,359 15,288 15,378 15,635 15,241 16,671 17,923 17,754 17,911 17,339Demand responsive e U U U U U 586 694 731 797 904 929 977 629 855 826 900 946 1,007 1,048 1,108 1,133 1,188 1,212 1,252 1,358 1,418 1,406Ferry boat g U U U U U U 460 454 436 418 418 418 411 409 451 474 480 475 485 590 575 578 579 613 628 587 626Other g U U U U 628 707 200 238 293 404 373 439 830 932 1,053 1,125 1,018 1,074 1,098 1,012 1,199 1,355 1,434 1,555 1,860 2,018 2,047RailIntercity/Amtrak h 27,462 21,340 9,944 6,326 7,247 7,765 9,748 10,095 9,803 9,976 9,529 8,924 8,127 8,314 8,536 8,578 8,848 8,946 8,800 9,141 8,869 8,660 8,706 9,309 9,943 9,518 10,332KEY: R = revised; U = data are unavailable.a1960-2006 data are for Passenger Cars and Other 2-axle, 4-tire vehicles , respectively. Data for 1960-2006 are not comparable to data for 2007-09.b U.S. <strong>Department</strong> <strong>of</strong> <strong>Transportation</strong>, Federal Highway Administration (FHWA), provides data separately for Light duty vehicle, short wheel base (formerly Passenger car ) and Motorcycle in its annual HighwayStatistics series. However, the 1995 summary report provides updated data for Light duty vehicle, short wheel base (formerly Passenger car ) and Motorcycle combined. Light duty vehicle, short wheel base (formerlyPassenger car ) figures in this table were computed by U.S. <strong>Department</strong> <strong>of</strong> <strong>Transportation</strong>, Bureau <strong>of</strong> <strong>Transportation</strong> Statistics, by subtracting the most current motorcycle figures from the aggregate Light duty vehicle,short wheel base (formerly Passenger car ) and Motorcycle figures.c 1960-65, Motorcycle data are included in Light duty vehicle, short wheel base (formerly Passenger car ), and Long duty vehicle, long wheel base (formerly Other 2-axle 4-tire vehicle ) data included in Single-unit 2-axle 6-tire or more Truck .d Light duty vehicles, long wheel base (formerly Other 2-axle 4-tire vehicles) are included in single-unit 2-axle 6-tire or more truck in 1960 and 1965.eMotor bus and demand responsive figures are also included in the bus figure for highway.f Prior to 1985, excludes demand responsive and most rural and smaller systems funded via Sections 18 and 16(b)2, Federal Transit Act. The series is not continuous between 1980 and 1985. Transit rail modes aremeasured in car-miles. Car-miles measure individual vehicle-miles in a train. A 10-car train traveling 1 mile would equal 1 train-mile and 10 car-miles.g Ferry boats are included in Other in 1980 and 1985.h National Passenger Railroad Corporation (Amtrak ) began operations in 1971. Does not include contract commuter passengers.NOTESAir carrier passenger-kilometers are computed by summing the products <strong>of</strong> the aircraft-kilometers flown on each interairport segment multiplied by the number <strong>of</strong> passengers carried on that segment. Highwaypassenger-kilometers from 1960 to 1994 are calculated by multiplying vehicle-kilometers <strong>of</strong> travel as cited by FHWA by the average number <strong>of</strong> occupants for each vehicle type. Average vehicle occupancy rates arebased on various sources, such as the National Household Travel Survey, conducted by the Federal Highway Administration, and the Vehicle Inventory and Use Survey, conducted by the Bureau <strong>of</strong> the Census. Transitpassenger-kilometers are the cumulative sum <strong>of</strong> the distances ridden by each passenger. Rail passenger-kilometers represent the movement <strong>of</strong> 1 passenger for 1 Kilometer.Highway data for 2007-09 were calculated using a new methodology developed by FHWA. Data for these years are based on new categories and are not comparable to previous years. The new category Light dutyvehicle, short wheel base includes passenger cars, light trucks, vans and sport utility vehicles with a wheelbase (WB) equal to or less than 121 inches. The new category Light duty vehicle, long wheel base includeslarge passenger cars, vans, pickup trucks, and sport/utility vehicles with wheelbases (WB) larger than 121 inches.2007 data for Bus, Paratransit (Demand responsive), and Other are not comparable to earlier years due to change in the method <strong>of</strong> data collection and estimation by the American Public<strong>Transportation</strong> Association (APTA).Transit data from 1996 and after are not comparable to the data for earlier years or to the data published in previous editions <strong>of</strong> the report due to different data sources used.Numbers may not add to totals due to rounding.1 mile = 1.609344 kilometersSOURCESAir:Air carrier, domestic, all services:1960: Civil Aeronautics Board, Handbook <strong>of</strong> Airline Statistics, 1969 (Washington, DC: 1970), part III, table 2.1965-70: Ibid., Handbook <strong>of</strong> Airline Statistics, 1973 (Washington, DC: 1974), part III, table 2.1975-2010: U.S. <strong>Department</strong> <strong>of</strong> <strong>Transportation</strong>, Bureau <strong>of</strong> <strong>Transportation</strong> Statistics, Office <strong>of</strong> Airline Information, Air Carrier Summary : T1: U.S. Air Carrier Traffic And Capacity Summary by Service Class , available athttp://www.transtats.bts.gov/DL_SelectFields.asp?Table_ID=264&DB_Short_Name=Air%20Carrier%20Summary as <strong>of</strong> Jan. 12, 2012.Highway:Passenger car and motorcycle:1960-94: U.S. <strong>Department</strong> <strong>of</strong> <strong>Transportation</strong>, Federal Highway Administration, Highway Statistics Summary to 1995, table VM-201A, available at http://www.fhwa.dot.gov/policyinformation/statistics.cfm as <strong>of</strong> May 6,2011.1995-99: Ibid., Highway Statistics (Washington, DC: Annual Issues), table VM-1, available at http://www.fhwa.dot.gov/policyinformation/statistics.cfm as <strong>of</strong> May 6, 2011.Light duty vehicle, short wheel base:2000-10: U.S. <strong>Department</strong> <strong>of</strong> <strong>Transportation</strong>, Federal Highway Administration, Highway Statistics (Washington, DC: Annual Issues), table VM-1, available at http://www.fhwa.dot.gov/policyinformation/statistics.cfm asMotorcycle:1970-80: U.S. <strong>Department</strong> <strong>of</strong> <strong>Transportation</strong>, Federal Highway Administration, Highway Statistics Summary to 1985 (Washington, DC: 1986), table VM-201A.1985-2010: Ibid., Highway Statistics (Washington, DC: Annual Issues), table VM-1, available at http://www.fhwa.dot.gov/policyinformation/statistics.cfm as <strong>of</strong> Mar. 12, 2012.Other 2-axle 4-tire vehicle:1970-94: U.S. <strong>Department</strong> <strong>of</strong> <strong>Transportation</strong>, Federal Highway Administration, Highway Statistics Summary to 1995 , table VM-201A, available at http://www.fhwa.dot.gov/policyinformation/statistics.cfm as <strong>of</strong> May 6,1995-99: Ibid., Highway Statistics (Washington, DC: Annual Issues), table VM-1, available at http://www.fhwa.dot.gov/policyinformation/statistics.cfm as <strong>of</strong> May 6, 2011.Light duty vehicle, long wheel base:2000-10: U.S. <strong>Department</strong> <strong>of</strong> <strong>Transportation</strong>, Federal Highway Administration, Highway Statistics (Washington, DC: Annual Issues), table VM-1, available at http://www.fhwa.dot.gov/policyinformation/statistics.cfm asSingle-unit 2-axle 6-tires or more truck, combination truck, and bus:1960-94: U.S. <strong>Department</strong> <strong>of</strong> <strong>Transportation</strong>, Federal Highway Administration, Highway Statistics Summary to 1995 , table VM-201A, available at http://www.fhwa.dot.gov/policyinformation/statistics.cfm as <strong>of</strong> May 6,1995-2010: Ibid., Highway Statistics (Washington, DC: Annual Issues), table VM-1, available at http://www.fhwa.dot.gov/policyinformation/statistics.cfm as <strong>of</strong> Mar. 12, 2012.Transit:Ferryboat:1992: American Public Transit Association, personal communication, July 19, 2000.1993-95: American Public Transit Association, personal communication, Aug. 13, 2001.1996-2010: U.S. <strong>Department</strong> <strong>of</strong> <strong>Transportation</strong>, Federal Transit Administration, National Transit Database , available at http://www.ntdprogram.gov/ntdprogram/data.htm as <strong>of</strong> May 9, 2011.All other data:1960-1995: American Public <strong>Transportation</strong> Association, Public <strong>Transportation</strong> Fact Book (Washington, DC: Annual Issues), table 2 and similar tables in earlier editions.1996-2010: U.S. <strong>Department</strong> <strong>of</strong> <strong>Transportation</strong>, Federal Transit Administration, National Transit Database , available at http://www.ntdprogram.gov/ntdprogram/data.htm as <strong>of</strong> May 9, 2011.Rail, Intercity / Amtrak:1960-80: Association <strong>of</strong> American Railroads, Railroad Facts (Washington, DC: Annual Issues).1985: Amtrak, Amtrak FY95 Annual Report (Washington, DC: 1996), Statistical Appendix, page 4.1990-2002: Ibid., Amtrak Annual Report (Washington, DC: Annual Issues), Statistical Appendix.2003-10: Association <strong>of</strong> American Railroads, Railroad Facts (Washington, DC: Annual Issues), page 77.
a Includes freight, express, and mail revenue ton-miles as reported on U.S. DOT Form 41.bExcludes intraterritorial traffic, for which ton-miles were not compiled.1960 1965 1970 1975 1980 1985 1990 1991 1992 1993 1994 1995 1996 1997 1998 1999 2000 2001 2002 2003 2004 2005 2006 2007 2008 2009cThe large increase between1975 and 1980 was a result <strong>of</strong> a new Alaska pipeline and consequent water transportation <strong>of</strong> crude petroleum from AlaskanTable 1-49M: U.S. Tonne-Kilometers <strong>of</strong> Freight (Millions)TOTAL U.S. tonne-kilometers <strong>of</strong> freight (millions) U (R) 1,735,956 (R) 1,990,983 (R) 2,672,780 (R) 3,552,874 (R) 3,415,473 4,839,335 4,888,912 4,990,309 5,020,175 5,277,541 5,502,687 5,582,528 5,555,831 5,594,959 5,704,438 5,704,172 (R) 5,740,348 (R) 5,802,335 (R) 5,879,297 U U U U U UAir carrier, domestic, all services a 807 1,975 3,955 5,066 6,611 7,528 13,233 12,935 14,337 15,585 17,232 18,279 18,777 19,857 20,206 20,735 21,874 (R) 21,261 (R) 20,420 (R) 22,205 (R) 24,018 (R) 22,937 (R) 22,343 (R) 22,006 (R) 20,068 17,559Intercity truck U U U U U U 1,246,816 1,276,016 1,308,135 1,366,534 1,454,132 1,521,291 1,563,630 1,633,709 1,677,508 1,731,527 1,756,346 1,787,006 1,832,265 1,845,405 U U U U U UClass I rail 835,555 1,018,882 1,116,600 1,101,187 1,341,653 1,280,372 1,509,566 1,516,728 1,557,470 1,619,560 1,752,990 1,906,268 1,979,686 1,969,394 2,010,092 2,092,813 2,140,261 2,183,347 2,200,194 2,265,056 2,427,347 2,476,733 2,586,920 2,584,946 2,594,715 2,236,990Domestic water transportation b,c U 715,099 870,428 826,321 1,345,855 1,303,711 1,216,951 1,238,639 1,250,736 1,152,878 1,189,759 1,179,260 1,116,421 1,032,799 982,262 957,539 942,849 907,644 893,620 884,957 906,891 863,248 819,962 807,585 759,945 696,584Coastwise U 441,708 525,275 461,126 921,460 892,009 699,522 733,100 733,360 654,658 668,084 642,892 595,794 510,761 459,692 427,378 414,445 400,848 384,977 407,213 408,584 384,650 331,640 332,950 303,495 286,578Lakewise U 110,838 115,946 100,033 90,149 70,347 88,956 80,794 81,444 82,398 85,063 87,166 85,168 90,760 90,014 83,284 84,502 74,245 78,332 69,406 81,369 75,808 77,532 75,762 73,383 48,923Internal U 160,161 227,487 263,378 331,914 339,746 426,886 423,332 434,544 414,477 434,725 447,232 433,306 429,265 430,540 444,889 441,727 430,489 428,371 406,387 414,772 400,568 408,468 396,554 380,994 357,685Intraport U 2,392 1,721 1,785 2,331 1,609 1,587 1,413 1,387 1,346 1,887 1,970 2,153 2,012 2,016 1,989 2,176 2,063 1,940 1,950 2,167 2,221 2,323 2,320 2,074 3,398cOil pipeline U U U 740,206 858,756 823,862 852,770 844,594 859,632 865,617 863,427 877,589 904,015 900,073 904,891 901,825 842,842 841,090 855,836 861,675 875,399 886,933 848,682 814,226 (R) 919,636 UKEY: R = revised; U = data are unavailable.ports to the mainland United States for refining.NOTESNumbers may not add to totals due to rounding.Eno <strong>Transportation</strong> Foundation has discontinued its intercity truck data for years prior to 1990.1.459972 tonne-kilometers= 1 ton-mile.SOURCESAir carrier, domestic, all services:1960-65: Civil Aeronautics Board, Handbook <strong>of</strong> Airline Statistics, 1969 (Washington, DC: 1970).1970-80: Ibid., Air Carrier Traffic Statistics (Washington, DC: Annual Issues), p. 2, line 3.1985-2000: U.S. <strong>Department</strong> <strong>of</strong> <strong>Transportation</strong>, Research and Innovative Technology Administration, Bureau <strong>of</strong> <strong>Transportation</strong> Statistics, Office <strong>of</strong> AirlineInformation, Air Carrier Traffic Statistics (Washington, DC: Annual Issues), p. 3, line 3.2001-2009: U.S. <strong>Department</strong> <strong>of</strong> <strong>Transportation</strong>, Research and Innovative Technology, Administration, Bureau <strong>of</strong> <strong>Transportation</strong> Statistics, TranStats table,Intercity truck:1960-2003: Eno <strong>Transportation</strong> Foundation, Inc., <strong>Transportation</strong> in America, 2007 (Washington, DC: 2007), p. 40.Class I rail:Association <strong>of</strong> American Railroads, Railroad Facts (Washington, DC: Annual Issue), p. 27.Domestic water transportation:U.S. Army Corps <strong>of</strong> Engineers, Waterborne Commerce <strong>of</strong> the U.S. (New Orleans, LA: Annual Issues), part 5, section 1, table 1-4, and similar tables inOil pipeline:1975: Association <strong>of</strong> Oil Pipe Lines, Shifts in Petroleum <strong>Transportation</strong> (Washington, DC: Annual Issue), table 4.1980-2008: Ibid., Shifts in Petroleum <strong>Transportation</strong> (Washington, DC: Annual Issues), table 1.
- Page 1:
NationalTransportationStatistics
- Page 4 and 5:
AcknowledgmentsU.S. Department of T
- Page 7 and 8:
Table of ContentsINTRODUCTIONTable
- Page 9 and 10:
1-56 U.S. Waterborne Freight (Updat
- Page 11 and 12:
SECTION E. RAILROAD2-39 Railroad an
- Page 13 and 14:
3-35 Transportation Expenditures by
- Page 15 and 16:
4-51 Air Pollution Trends in Select
- Page 18:
IntroductionCompiled and published
- Page 21:
SOURCESU.S. resident population, ag
- Page 25 and 26:
Table 1-1: System Mileage Within th
- Page 27 and 28:
Table 1-3: Number of U.S. Airports
- Page 29 and 30:
Table 1-5: U.S. Public Road and Str
- Page 31 and 32:
Table 1-7: Number of Stations Serve
- Page 33 and 34:
Table 1-9: ADA-Accessible Rail Tran
- Page 36:
Section BVehicle, Aircraft, andVess
- Page 39 and 40:
Table 1-12: U.S. Sales or Deliverie
- Page 41 and 42:
Table 1-14: U.S. Automobile and Tru
- Page 43 and 44:
Table 1-16: Retail a New Passenger
- Page 45 and 46:
Table 1-18: Retail Sales of New Car
- Page 47 and 48:
Table 1-20: Period Sales, Market Sh
- Page 49 and 50:
Table 1-22: Number of Trucks by Wei
- Page 51 and 52:
Taiwan U U U 116 132 124 101 113 11
- Page 53:
Section CCondition
- Page 56 and 57:
Table 1-26: Average Age of Automobi
- Page 58 and 59:
Table 1-28: Condition of U.S. Highw
- Page 60 and 61:
Table 1-30: Condition of Urban Bus
- Page 62 and 63:
Table 1-32: Class I Railroad Locomo
- Page 64 and 65:
Table 1-34: U.S. Flag Vessels by Ty
- Page 66 and 67:
Table 1-36: Roadway Vehicle-Miles T
- Page 68 and 69:
Table 1-38: Average Length of Haul,
- Page 70 and 71:
Table 1-40: U.S. Passenger-Miles (M
- Page 72 and 73:
Table 1-42: Long-Distance Travel in
- Page 74 and 75:
Table 1-43: Long-Distance Travel in
- Page 76 and 77:
Table 1-45: Air Passenger Travel Ar
- Page 79:
Section DTravel and GoodsMovement
- Page 82 and 83:
Table 1-48: U.S.-Mexican Border Lan
- Page 84 and 85:
Table 1-50: U.S. Ton-Miles of Freig
- Page 86 and 87:
Table 1-52: U.S.-Canadian Border La
- Page 88 and 89:
Table 1-54: U.S.-Mexican Border Lan
- Page 90 and 91:
Table 1-56: U.S. Waterborne Freight
- Page 92 and 93:
Table 1-58: Freight Activity in the
- Page 94 and 95:
Table 1-60: Value of U.S. Land Expo
- Page 96 and 97:
Table 1-61M: Crude Oil and Petroleu
- Page 98:
Table 1-63: U.S. Hazardous Material
- Page 102 and 103:
Table 1-64: Passengers Boarded and
- Page 104 and 105:
Table 1-66: Flight Operations Arriv
- Page 106 and 107:
Table 1-68: Major U.S. Air Carrier
- Page 108 and 109:
Table 1-69: Annual Person-Hours of
- Page 110 and 111:
Table 1-70: Travel Time IndexShort-
- Page 112 and 113:
Table 1-71: Annual Roadway Congesti
- Page 114:
Table 1-73: Amtrak On-Time Performa
- Page 118 and 119:
Table 2-1: Transportation Fatalitie
- Page 120 and 121:
Table 2-3: Transportation Accidents
- Page 122 and 123:
Table 2-5: Highway-Rail Grade-Cross
- Page 124 and 125:
Table 2-7: Transportation-Related O
- Page 127:
Section BAir
- Page 130 and 131:
Table 2-10: U.S. Commuter Air Carri
- Page 132 and 133:
Table 2-12: U.S. Commuter Air Carri
- Page 134 and 135:
Table 2-14: U.S. General Aviation a
- Page 136 and 137:
Table 2-16b: Prohibited Items Inter
- Page 139:
Section CHighway
- Page 142 and 143:
Table 2-18: Motor Vehicle Fatalitie
- Page 144 and 145:
Table 2-20: Occupant and Nonmotoris
- Page 146 and 147:
Table 2-22: Motorcycle Rider Safety
- Page 148 and 149:
Table 2-24: Bus Occupant Safety Dat
- Page 150 and 151:
Table 2-26: Fatalities by Highest B
- Page 152 and 153:
Table 2-28: Motor Vehicle Fatal Cra
- Page 154 and 155:
Table 2-30: Safety Belt and Motorcy
- Page 157:
Section DTransit
- Page 160 and 161:
Table 2-33: Transit Safety Data by
- Page 162 and 163:
d The number of Unlinked passenger
- Page 164 and 165:
Table 2-36: Transit and Grade-Cross
- Page 166 and 167:
Table 2-38: Reports of Violent Crim
- Page 168:
KEY: N = data do not exist.a The ki
- Page 172 and 173:
Table 2-39: Railroad and Grade-Cros
- Page 174 and 175:
Table 2-41: Train Fatalities, Injur
- Page 176 and 177:
Table 2-43: Railroad System Safety
- Page 178:
Section FWater
- Page 181 and 182:
Table 2-46: Waterborne Transportati
- Page 183 and 184:
Table 2-48: Personal Watercraft Saf
- Page 186:
Section GPipeline
- Page 190:
Chapter 3Transportation andthe Econ
- Page 193 and 194:
Table 3-2: U.S. Gross Domestic Prod
- Page 195 and 196:
Table 3-4: U.S. Gross Domestic Prod
- Page 197 and 198:
Table 3-6: U.S. Gross Domestic Dema
- Page 199 and 200:
Table 3-8: Contributions to Gross D
- Page 201 and 202:
Table 3-10: National Transportation
- Page 204 and 205:
Table 3-11: Sales Price of Transpor
- Page 206 and 207:
Table 3-13: Producer Price Indices
- Page 208 and 209:
Table 3-15: Personal Expenditures b
- Page 210 and 211:
Table 3-17: Average Cost of Owning
- Page 212:
Table 3-19: Average Passenger Fares
- Page 216 and 217:
Table 3-20: Average Passenger Reven
- Page 218 and 219:
Table 3-22: Total Operating Revenue
- Page 220 and 221:
Table 3-24: Employment in Transport
- Page 222 and 223:
Table 3-26: Median Weekly Earnings
- Page 224:
Table 3-28: Labor Productivity Indi
- Page 228 and 229:
Table 3-29: Federal, State, and Loc
- Page 230 and 231:
Table 3-31: Summary of Transportati
- Page 232 and 233:
Table 3-33: Transportation Revenues
- Page 234 and 235:
Table 3-35: Transportation Expendit
- Page 236 and 237:
Table 3-37: Federal Transportation
- Page 239:
Chapter 4Transportation, Energy,and
- Page 242 and 243:
Table 4-2: U.S. Consumption of Ener
- Page 245:
Section BTransportation EnergyConsu
- Page 248 and 249:
Table 4-5: Fuel Consumption by Mode
- Page 250 and 251:
Table 4-7: Domestic Demand for Gaso
- Page 252 and 253:
Table 4-9: Motor Vehicle Fuel Consu
- Page 254 and 255:
Table 4-11: Light Duty Vehicle, Sho
- Page 256 and 257:
Table 4-13: Single-Unit 2-Axle 6-Ti
- Page 258 and 259:
Table 4-15: Bus Fuel Consumption an
- Page 260 and 261:
Table 4-17: Class I Rail Freight Fu
- Page 262 and 263:
Table 4-19: U.S. Government Energy
- Page 265 and 266:
Table 4-20: Energy Intensity of Pas
- Page 267 and 268:
Table 4-22: Energy Intensity of Lig
- Page 269 and 270:
Table 4-24: Energy Intensity of Tra
- Page 271 and 272:
Table 4-26: Energy Intensity of Amt
- Page 273 and 274:
Table 4-28: Annual Wasted Fuel Due
- Page 275 and 276: Table 4-29: Annual Wasted Fuel Per
- Page 278: Section DAir Pollution
- Page 281 and 282: Table 4-31: Federal Exhaust Emissio
- Page 283 and 284: 1968-Table 4-33: Federal Exhaust Em
- Page 285 and 286: Table 4-35: Federal Exhaust Emissio
- Page 287 and 288: KEY: CO = carbon monoxide; HC = hyd
- Page 289 and 290: Table 4-38: Federal Exhaust Emissio
- Page 291 and 292: KEY: CO = carbon monoxide; g = gram
- Page 293 and 294: KEY: bhp = brake horsepower; bhph =
- Page 295 and 296: Table 4-42: Tier 2 Federal Exhaust
- Page 297 and 298: Table 4-44: Estimated National Aver
- Page 299 and 300: Table 4-46: Estimated National Emis
- Page 301 and 302: Table 4-48: Estimated National Emis
- Page 303 and 304: Table 4-50: Estimated National Emis
- Page 305 and 306: Monmouth-Ocean, NJ 5 21 4 41 34 31
- Page 307 and 308: Table 4-52: Areas in Nonattainment
- Page 310: Section EWater Pollution, Noise,and
- Page 313 and 314: Table 4-55: Leaking Underground Sto
- Page 315 and 316: Table 4-57: Number of People Residi
- Page 318: appendix aMetric ConversionTables
- Page 321 and 322: Table 1-4M: Kilometers of Public Ro
- Page 323 and 324: Table 1-35M: U.S. Vehicle-Kilometer
- Page 325: Table 1-38M: Average Length of Haul
- Page 329 and 330: Table 1-56M: U.S. Waterborne Freigh
- Page 331 and 332: Table 4-3M: Domestic Demand for Ref
- Page 333 and 334: Table 4-6M: Energy Consumption by M
- Page 335 and 336: Table 4-8M: Certificated Air Carrie
- Page 337 and 338: Table 4-11M: Light Duty Vehicle, Sh
- Page 339 and 340: Table 4-13M: Single-Unit 2-Axle 6-T
- Page 341 and 342: Table 4-15M: Bus Fuel Consumption a
- Page 343 and 344: Table 4-17M: Class I Rail Freight F
- Page 345 and 346: Table 4-19M: U.S. Government Energy
- Page 347 and 348: Table 4-21M: Energy Intensity of Ce
- Page 349 and 350: Table 4-23M: Average Fuel Efficienc
- Page 351 and 352: Table 4-25M: Energy Intensity of Cl
- Page 353 and 354: Appendix B: GlossaryAIR CARRIER: A
- Page 355 and 356: Appendix B: GlossaryCOLLISION WITH
- Page 357 and 358: Appendix B: GlossaryFEDERAL ENERGY
- Page 359 and 360: Appendix B: GlossaryINJURY (Rail):
- Page 361 and 362: Appendix B: GlossaryMOTOR BUS (Tran
- Page 363 and 364: Appendix B: GlossaryPERSONAL BUSINE
- Page 365 and 366: Appendix B: GlossarySUBCOMPACT CAR:
- Page 367 and 368: appendix cAcronyms and InitialismsA
- Page 370: appendix dModal Profiles
- Page 373 and 374: Air Carrier Profile continuedPerfor
- Page 375 and 376: Air Carrier Profile continuedPerfor
- Page 377 and 378:
Highway ProfileFINANCIAL 1960 1970
- Page 379 and 380:
General Aviation ProfileINVENTORY 1
- Page 381 and 382:
Motorcycle f f f f 50 50 50 50 50 5
- Page 383 and 384:
KEY: R = revised; U = data are unav
- Page 385 and 386:
Transit ProfileFINANCIAL 1960 1970
- Page 387 and 388:
161960-2006: Fatalities and Injured
- Page 389 and 390:
SAFETY d,9Number of fatalities, rai
- Page 391 and 392:
SAFETYFatalities in waterborne tran
- Page 393 and 394:
Natural Gas Pipeline ProfileFINANCI
- Page 395:
appendix eSource andAccuracy Statem
- Page 398 and 399:
agencies receiving funds through th
- Page 400 and 401:
solicitations of all federally regu
- Page 402 and 403:
Passenger Car, Truck, Bus, and Recr
- Page 404 and 405:
Highway, Total (registered vehicles
- Page 406 and 407:
after 1996. Some jurisdictions fail
- Page 408 and 409:
adherence to federal guidelines reg
- Page 410 and 411:
year. Also, expansion factors are u
- Page 412 and 413:
PassengerAir CarrierThe U.S. Depart
- Page 414 and 415:
The data are from Waterborne Commer
- Page 416 and 417:
The Transborder Surface Freight Dat
- Page 418 and 419:
A second data source for air-carrie
- Page 420 and 421:
Appendix EData Source and Accuracy
- Page 422 and 423:
when data are entered, they are che
- Page 424 and 425:
vehicles, and 15 were deleted becau
- Page 426 and 427:
TABLE 2-4. Distribution of Transpor
- Page 428 and 429:
BEA personal consumption expenditur
- Page 430 and 431:
Transportation-related government p
- Page 432 and 433:
information on their data collectio
- Page 434 and 435:
AccuracyAs in all surveys, the accu
- Page 436 and 437:
The American Public Transit Associa
- Page 438 and 439:
Government EmploymentThe Office of
- Page 440 and 441:
specifications or equations, should
- Page 442 and 443:
As mentioned above, the Highway Rev
- Page 444 and 445:
Highway ExpendituresFederal Highway
- Page 446 and 447:
consistency between the different m
- Page 448 and 449:
Appendix EData Source and Accuracy
- Page 450 and 451:
when data are entered, they are che
- Page 452 and 453:
vehicles, and 15 were deleted becau
- Page 454 and 455:
TABLE 2-4. Distribution of Transpor
- Page 456 and 457:
agencies receiving funds through th
- Page 458 and 459:
solicitations of all federally regu
- Page 460 and 461:
Passenger Car, Truck, Bus, and Recr
- Page 462 and 463:
Highway, Total (registered vehicles
- Page 464 and 465:
after 1996. Some jurisdictions fail
- Page 466 and 467:
adherence to federal guidelines reg
- Page 468 and 469:
year. Also, expansion factors are u
- Page 470 and 471:
PassengerAir CarrierThe U.S. Depart
- Page 472 and 473:
The data are from Waterborne Commer
- Page 474 and 475:
The Transborder Surface Freight Dat
- Page 476 and 477:
A second data source for air-carrie
- Page 478 and 479:
Appendix EData Source and Accuracy
- Page 480 and 481:
If transportation had been reviewed
- Page 482 and 483:
Alternative FuelsIn addition to oxy
- Page 484 and 485:
RailThe data are from Railroad Fact
- Page 486 and 487:
multiplied by the average peak peri
- Page 488 and 489:
In general, lead emissions are esti
- Page 490 and 491:
The number of the people exposed to
- Page 492 and 493:
Appendix EData Source and Accuracy
- Page 494 and 495:
If transportation had been reviewed
- Page 496 and 497:
Alternative FuelsIn addition to oxy
- Page 498 and 499:
RailThe data are from Railroad Fact
- Page 500 and 501:
multiplied by the average peak peri
- Page 502 and 503:
In general, lead emissions are esti
- Page 504 and 505:
The number of the people exposed to