Table 3-22: Total Operating Revenues (Current $ millions)1960 1965 1970 1975 1980 1985 1990 1991 1992 1993 1994 1995 1996 1997 1998 1999 2000 2001 2002 2003 2004 2005 2006 2007 2008 2009 2010Air carrier, domestic, all services 2,178 3,691 7,180 12,020 26,440 37,629 57,961 56,165 57,654 63,233 65,949 70,885 76,891 82,250 86,494 90,931 98,896 86,511 79,501 89,011 101,000 112,053 121,087 124,604 129,795 (R) 109,749 120,944Trucking a N N N N N N 127,314 126,772 135,437 142,547 155,713 161,806 172,743 183,153 197,314 207,751 223,197 221,355 222,383 (R) 228,204 (R) 247,866 (R) 266,996 (R) 286,211 295,710 (R) 300,945 (R) 250,309 266,238Class I bus, intercity 463 607 722 955 1,397 1,233 943 981 938 928 870 917 912 996 999 1,014 1,088 1,076 1,070 U U U U U U U UTransit b 1,407 1,444 1,707 3,451 6,510 12,195 16,053 16,533 16,915 17,276 17,968 18,241 17,964 18,357 19,124 20,576 21,979 23,725 24,186 25,826 27,089 28,828 32,186 33,762 36,502 37,490 UClass I rail 9,514 10,208 11,992 16,402 28,258 27,586 28,370 27,845 28,349 28,825 30,809 32,279 32,693 33,118 33,151 33,521 34,102 34,576 35,327 36,639 40,517 46,118 52,152 54,600 61,243 47,849 58,406Intercity /Amtrak c N N N 253 454 832 1,308 1,347 1,320 1,400 1,409 1,490 1,550 1,669 2,244 2,011 2,111 2,109 2,228 2,074 1,865 1,886 2,043 2,153 2,453 2,353 2,513Water transportation (domestic) d U U U U U U 11,532 U U U U 11,093 10,491 9,670 9,184 8,966 8,819 8,512 8,365 8,308 8,482 U U U U U UOil pipeline e U U U U U U 13,443 U U U U 11,482 11,289 10,951 10,166 10,713 11,077 11,271 11,303 11,178 11,841 7,917 8,517 8,996 9,244 9,987 11,219Gas pipeline (investor-owned) f 8,700 11,500 16,400 30,551 85,918 103,945 66,027 63,922 66,405 69,965 63,430 58,435 72,025 U 57,548 59,142 72,075 79,276 68,594 75,567 80,331 102,061 97,197 97,236 109,600 87,457 84,362Transmission companies 3,190 4,088 5,928 11,898 41,604 45,738 21,756 19,818 20,193 19,873 13,841 12,092 12,050 10,339 9,450 9,555 10,404 10,257 10,096 10,892 11,313 16,547 15,364 15,846 18,186 13,127 12,188Distribution companies N N N 5,938 14,013 21,510 18,750 17,812 19,854 20,307 20,911 19,421 30,407 30,864 28,182 28,135 34,696 39,179 31,210 38,199 40,410 51,022 48,942 46,064 56,092 44,937 44,624Integrated companies N N N 6,962 17,300 17,396 10,117 11,047 10,279 12,506 11,827 10,899 11,941 12,125 2,974 3,086 3,755 4,184 3,150 3,753 2,424 2,803 2,698 2,940 2,900 2,606 2,295Combination companies N N N 5,753 13,001 19,301 15,404 15,245 16,079 17,279 16,851 16,023 17,627 U 16,942 18,366 23,220 25,656 24,138 22,723 26,184 31,689 30,193 32,386 32,422 26,787 25,255KEY: N = data do not exist; R = revised; U = data are not available.aData from 1990 through 1997 include local trucking (4212), trucking, except local (4213), local trucking, without storage (4214), and courier services, except air (4215)based on SIC (Standard Industrial Classification). For 1998 and later, data includes truck transportation (484) and couriers and messengers (492) based on NAICS (NorthAmerican Industry Classification System). Therefore, data from 1998 onward are not directly comparable with data prior to 1998.bExcludes commuter rail, automated guideway, urban boat, demand responsive, and most rural and smaller systems prior to 1984. Includes operating assistance.c Amtrak began operations in 1971.d Includes foreign traffic moving on domestic inland waterways.e Oil pipeline revenues are much smaller than gas pipeline revenues because oil pipeline companies are common carriers that include transportation costs only.fData are not directly comparable from year to year due to acquisition and mergers. Prior to 1975, pipeline companies are not categorized by distribution, integrated, orcombination. Total numbers for these companies are 1960 = 5,505; 1965 = 7,437; 1970 = 10,542. In 1997, the American Gas Association revised the database that identifiescompanies by type (distribution, integrated, or transmission). This reclassification <strong>of</strong> companies has resulted in numerous additions to the distribution company sample, inparticular from the integrated company sample.NOTEEno <strong>Transportation</strong> Foundation has revised their methodologies for calculating water transportation and oil pipeline data series starting in 1990.SOURCESAir carrier, domestic, all services:1960-70: Civil Aeronautics Board, Handbook <strong>of</strong> Airline Statistics, 1973 (Washington, DC: March 1974).1975-80: Ibid., Air Carrier Financial Statistics (Washington, DC: Annual Issues), p. 1.1985-2001: U.S. <strong>Department</strong> <strong>of</strong> <strong>Transportation</strong>, Bureau <strong>of</strong> <strong>Transportation</strong> Statistics, Office <strong>of</strong> Airline Information, Air Carrier Financial Statistics (Washington, DC: AnnualDecember Issues).2002-10: U.S. <strong>Department</strong> <strong>of</strong> <strong>Transportation</strong>, Research and Innovative Technology Administration, Bureau <strong>of</strong> <strong>Transportation</strong> Statistics, Office <strong>of</strong> Airline Information,TranStats Database, Air Carrier Financial Reports , Schedule P-1.1 and Schedule P-1.2 , available athttp://www.transtats.bts.gov/databases.asp?Mode_ID=1&Mode_Desc=Aviation&Subject_ID2=0 as <strong>of</strong> Sept. 25, 2012Trucking:1990-97: U.S. <strong>Department</strong> <strong>of</strong> Commerce, U.S. Census Bureau, <strong>Transportation</strong> Annual Survey, 1998 (Washington, DC: January 2000), table 1.1998-2010: Ibid., Service Annual Survey (Washington, DC: Annual Issues), table 2.1, available at http://www.census.gov/services/ as <strong>of</strong> Sept. 25, 2012.Intercity Class I bus:1960-93: Interstate Commerce Commission, Annual Report <strong>of</strong> the Interstate Commerce Commission (Washington, DC: Annual Issues).1994-96: U.S. <strong>Department</strong> <strong>of</strong> <strong>Transportation</strong>, Bureau <strong>of</strong> <strong>Transportation</strong> Statistics, Selected Earnings Data, Class 1 Motor Carriers <strong>of</strong> Passengers (Washington, DC: AnnualIssues).1997-2001: U.S. <strong>Department</strong> <strong>of</strong> <strong>Transportation</strong>, Bureau <strong>of</strong> <strong>Transportation</strong> Statistics, Selected Earnings Data, Class 1 Motor Carriers <strong>of</strong> Passengers (Washington, DC:Annual Issues), available at http://www.fmcsa.dot.gov/forms/reporting/prod.htm as <strong>of</strong> May 31, 2011.2002: Ibid., personal communication, Oct. 6, 2004.Transit:1960-95: American Public <strong>Transportation</strong> Association, Public <strong>Transportation</strong> Fact Book, 2007 (Washington, DC: 2007), table 50 and similar tables in earlier editions.1996-2009: U.S. <strong>Department</strong> <strong>of</strong> <strong>Transportation</strong>, Federal Transit Administration, National Transit Database, Data Tables (Washington, D.C.: Annual Reports), tables 1, 26and similar tables in earlier editions, available at http://www.ntdprogram.gov/ntdprogram/data.htm as <strong>of</strong> May 25, 2011.Class I rail:1960-2010: Association <strong>of</strong> American Railroads, Railroad Facts (Washington, DC: Annual Issues), p. 12 and similar tables in earlier editions.Intercity/Amtrak:1975-80: National Railroad Passenger Corporation (Amtrak), State and Local Affairs <strong>Department</strong> and Public Affairs <strong>Department</strong>, personal communication.1985-2004: National Railroad Passenger Corporation (Amtrak), Amtrak Annual Report, Statistical Appendix (Washington, DC: Annual Issues).2005-10: Ibid., Amtrak Annual Report (Washington, DC: Annual Issues) available athttp://www.amtrak.com/servlet/ContentServer?c=AM_Content_C&pagename=am%2FLayout&cid=1241245659597 as <strong>of</strong> Sept. 25, 2012.Water transportation:1990-2004: Eno <strong>Transportation</strong> Foundation, Inc., <strong>Transportation</strong> in America (Washington, DC: 2007), p. 32.Oil pipeline:1990-2004: Eno <strong>Transportation</strong> Foundation, Inc., <strong>Transportation</strong> in America (Washington, DC: 2007), p. 32.2005-10: PennWell Corporation, Oil and Gas Journal: Special Report - Pipeline Economics (Houston, TX: September 2011), p 94.Gas pipeline:1960-2010: American Gas Association, Gas Facts (Washington, DC: Annual Issues), tables 11-1, 11-2, 11-3, and 11-4, and similar tables in earlier editions.
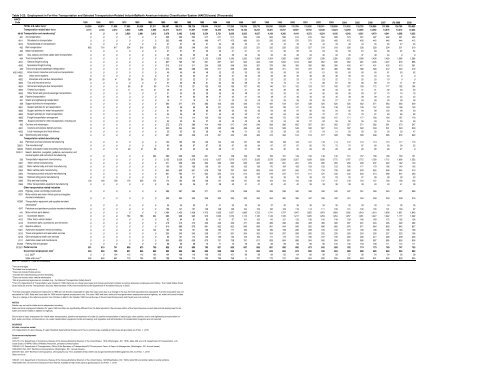
Table 3-23: Employment in For-Hire <strong>Transportation</strong> and Selected <strong>Transportation</strong>-Related Industriesa (North American Industry Classification System (NAICS) basis) (Thousands)NAICSCode 1960 1965 1970 1975 1980 1985 1990 1991 1992 1993 1994 1995 1996 1997 1998 1999 2000 2001 2002 2003 2004 2005 2006 2007 (R) 2008 2009TOTAL U.S. labor force b 54,296 60,874 71,006 77,069 90,528 97,511 109,487 108,375 108,726 110,844 114,291 117,298 119,708 122,776 125,930 128,993 131,785 131,826 130,341 129,999 131,435 133,703 136,086 137,598 136,790 130,920<strong>Transportation</strong> related labor force 2,115 2,133 2,312 3,040 3,054 3,550 12,317 12,011 11,867 11,981 12,350 12,705 12,192 13,247 13,481 13,767 13,907 13,752 13,438 13,224 13,259 13,395 13,492 13,516 13,212 12,23248-49 <strong>Transportation</strong> and warehousing c U U U 2,620 2,961 3,012 3,476 3,463 3,462 3,554 3,701 3,838 3,935 4,027 4,168 4,300 4,410 4,372 4,224 4,185 4,249 4,361 4,470 4,541 4,508 4,235481 Air transportation U U U U U U 529 525 520 517 511 511 526 542 563 586 614 615 564 528 515 501 487 492 491 4604811 Scheduled air transportation U U U U U U 503 498 491 486 477 473 486 501 520 543 570 570 520 485 472 456 442 446 444 4154812 Nonscheduled air transportation U U U U U U 27 27 29 31 34 38 40 41 43 44 45 45 44 43 43 44 45 46 47 45482 Rail transportation 862 716 617 534 518 350 272 256 248 242 235 233 225 221 225 229 232 227 218 218 226 228 228 234 231 219483 Water transportation U U U U U U 57 57 57 53 52 51 51 51 51 52 56 54 53 55 56 61 63 66 67 644831 Sea, coastal, and Great Lakes water transportation U U U U U U 35 36 35 33 33 32 32 32 32 33 36 34 32 34 35 37 39 40 U U484 Truck transportation U U U U U U 1,122 1,105 1,107 1,155 1,206 1,249 1,282 1,308 1,354 1,392 1,406 1,387 1,339 1,326 1,352 1,398 1,436 1,439 1,389 1,2664841 General freight trucking U U U U U U 807 795 797 831 867 901 924 942 976 1,002 1,013 992 952 935 950 981 1,005 1,007 976 8854842 Specialized freight trucking U U U U U U 315 310 311 324 339 348 359 367 379 390 393 395 388 390 402 417 431 432 413 381485 Transit and ground passenger transportation U U U U U U 274 284 288 300 317 328 339 350 363 371 372 375 381 382 385 389 399 412 423 4194851-4852 Urban transit, interurban and rural bus transportation U U U U U U 46 46 46 48 52 53 55 56 59 59 59 60 61 60 60 60 60 61 63 624851 Urban transit systems U U U U U U 21 23 25 27 29 31 33 35 36 36 35 36 38 38 39 40 40 40 U U4852 Interurban and rural bus transportation 38 39 41 38 36 33 25 23 22 21 22 23 23 21 23 23 23 24 23 22 21 20 20 19 U U4853 Taxi and limousine service U U U U U U 57 59 58 61 64 66 68 70 72 73 72 71 68 67 66 66 69 73 71 674854 School and employee bus transportation U U U 66 81 93 114 118 121 125 130 136 137 142 146 151 152 153 161 165 167 169 172 177 182 1844855 Charter bus industry U U U 11 15 21 26 27 27 28 28 29 31 32 34 36 38 37 36 33 32 31 31 32 33 304859 Other transit and ground passenger transportation U U U U U U 31 34 36 39 43 45 48 51 52 53 51 54 56 58 59 63 67 70 74 76486 Pipeline transportation U U U U U U 60 61 60 59 57 54 51 50 48 47 46 45 42 40 38 38 39 40 42 42487 Scenic and sightseeing transportation U U U U U U 16 17 18 19 21 22 23 25 25 26 28 29 26 27 27 29 28 29 28 28488 Support activities for transportation U U U U U U 364 377 370 382 405 430 446 473 497 518 537 539 525 520 535 552 571 584 592 5494881 Support activities for air transportation U U U U U U 96 96 96 99 101 104 109 115 124 133 141 140 139 136 142 148 157 163 168 1504883 Support activities for water transportation U U U U U U 91 96 89 86 89 92 90 92 94 96 97 95 95 94 92 94 99 100 99 934884 Support activities for road transportation U U U U U U 35 36 38 41 45 49 53 57 60 63 66 69 70 72 76 79 81 84 85 824885 Freight transportation arrangement U U U U U U 111 115 114 120 130 143 149 161 166 172 178 179 168 167 171 177 180 184 187 1764889 Support activities for other transportation, including rail U U U U U U 32 33 34 37 40 43 45 48 53 54 56 57 52 52 55 55 53 54 53 48492 Couriers and messengers U U U U U U 375 379 389 414 466 517 540 546 568 586 605 587 561 562 557 571 582 581 573 5474921 Couriers and express delivery services U U U U U U 340 344 354 378 423 469 489 494 513 528 546 530 507 510 507 522 533 531 523 5004922 Local messengers and local delivery U U U U U U 35 35 35 36 43 48 51 52 55 58 59 57 54 51 50 50 50 50 50 47493 Warehousing and storage U U U U U U 407 403 406 413 431 444 452 462 474 494 514 514 517 528 558 595 638 665 672 642<strong>Transportation</strong> related manufacturing324 Petroleum and coal products manufacturing U U U U U U 153 155 152 146 144 140 137 136 135 128 123 121 118 114 112 112 113 115 117 11532621 Tire manufacturing d U U U U U U 90 86 87 87 85 87 86 84 87 87 87 82 76 72 70 67 60 59 59 5232622 Rubber and plastic hoses and belting manufacturing U U U 29 31 26 25 23 23 24 26 27 27 28 29 30 30 29 28 28 28 29 28 28 27 U334511 Search, detection, navigation, guidance, aeronautical, andnautical system and instrument manufacturing U U U U U 354 280 256 226 201 175 158 158 159 163 161 149 150 148 145 151 157 158 158 153 151336 <strong>Transportation</strong> equipment manufacturing U U U U U U 2,135 2,029 1,978 1,915 1,937 1,979 1,975 2,028 2,078 2,089 2,057 1,939 1,830 1,775 1,767 1,772 1,769 1,712 1,608 1,3533361 Motor vehicle manufacturing U U U U U U 271 258 260 264 282 295 285 287 284 291 291 279 265 265 256 248 237 220 192 1433362 Motor vehicle body and trailer manufacturing U U U U U U 130 120 126 136 151 160 155 158 170 184 183 159 152 153 165 171 179 166 140 1053363 Motor vehicle parts manufacturing U U U U U U 653 639 661 678 736 787 800 809 818 837 840 775 734 708 692 678 655 608 544 4193364 Aerospace product and parts manufacturing U U U U U U 841 784 711 624 552 514 514 555 579 547 517 511 470 442 442 455 474 489 507 4933365 Railroad rolling stock manufacturing U U U U U U 31 28 27 29 33 35 33 32 35 35 33 28 23 23 25 27 28 28 29 233366 Ship and boat building 130 148 158 179 203 172 174 165 158 148 147 148 147 146 154 154 154 148 147 147 149 154 157 160 156 1323369 Other transportation equipment manufacturing U U U U U U 35 35 36 37 38 40 41 41 40 40 40 39 39 38 38 39 40 40 41 39Other transportation related industries2373 Highway, street, and bridge construction U U U U U U 289 267 264 271 274 278 288 294 308 336 340 346 346 340 347 351 348 345 327 2864231 Motor vehicle and motor vehicle parts and suppliesmerchant wholesalers U U U U U U 309 304 302 306 320 335 343 350 354 360 356 347 346 342 341 344 348 350 338 31642386 <strong>Transportation</strong> equipment and supplies merchantwholesalers e U U U U U U 35 34 33 31 31 32 33 35 37 40 39 36 34 32 32 33 33 34 35 354247 Petroleum and petroleum products merchant wholesalers U U U U U U 155 147 137 129 128 126 124 123 122 123 119 114 111 106 101 100 100 101 100 97441 Motor vehicle parts dealers U U U U U U 1,494 1,435 1,428 1,475 1,565 1,627 1,686 1,723 1,741 1,797 1,847 1,855 1,879 1,883 1,902 1,919 1,910 1,908 1,831 1,6404411 Automobile dealers U U U 769 783 904 983 938 935 970 1,032 1,072 1,113 1,135 1,142 1,180 1,217 1,225 1,253 1,254 1,257 1,261 1,247 1,242 1,177 1,0224412 Other motor vehicle dealers U U U U U U 93 84 81 83 91 97 101 105 110 121 132 136 142 149 159 166 169 172 162 1364413 Automotive parts, accessories, and tire stores U U U U U U 418 413 413 422 443 459 471 484 489 496 499 493 485 480 487 491 494 495 492 482447 Gasoline stations U U U U U U 910 889 876 881 902 922 946 956 961 944 936 925 896 882 876 871 864 862 842 8275321 Automotive equipment rental and leasing U U U U U 142 163 152 151 156 163 171 180 184 189 199 208 208 195 193 197 199 199 196 193 1695615 Travel arrangement and reservation services U U U U U U 250 240 245 256 271 281 294 302 304 297 299 285 252 235 226 224 226 227 223 1966219 Other ambulatory health care services U U U U U U 99 107 114 125 135 143 154 164 171 173 173 180 187 195 200 206 217 228 238 2468111 Automotive repair and maintenance U U U U U U 659 636 636 670 701 738 781 811 828 864 888 904 900 894 891 886 887 885 856 80681293 Parking lots and garages U U U U U U 68 69 68 70 71 75 78 82 85 89 93 96 96 100 102 103 108 111 114 111912001 Postal service 591 619 741 699 673 750 825 813 800 793 821 850 867 866 881 890 880 873 842 809 782 774 770 769 747 703Government employment, total f 532 650 795 831 846 852 903 905 884 892 900 899 U 895 842 862 873 890 932 894 888 888 885 890 895 893U.S. DOT g U U 104 112 112 100 104 108 110 109 103 101 99 98 69 65 64 66 99 59 57 56 54 54 56 58State and Local h,i 532 650 691 719 734 752 798 796 774 783 798 798 U 797 772 797 809 824 832 835 830 833 831 835 839 835KEY: R = revised; U = data are unavailable.a Annual averages.bExcludes farm employment.cDoes not include Postal servicedIncludes tire manufacturing and tire retreadingeDoes not include motor vehicle wholesalersf Not all government agencies are included (e.g., the National <strong>Transportation</strong> Safety Board)g The U.S. <strong>Department</strong> <strong>of</strong> <strong>Transportation</strong> was created in 1966. Data are on a fiscal year basis and include permanent civilians as well as temporary employees and military. The United States CoastGuard (<strong>US</strong>CG) and the <strong>Transportation</strong> Security Administration (TSA) were transferred to the <strong>Department</strong> <strong>of</strong> Homeland Security in 2003.hFull-time equivalent employment. Data prior to 1986 are not directly comparable to data from later years due to a change in the way full-time equivalent was calculated. Full-time equivalent was notcalculated for 1985. State and local data for 1960 include highway employment only. For years 1965 and later, state and local government employment covers highway, air, water and transit modes.i Due to a change in the reference period, from October to March, the October 1996 Annual Survey <strong>of</strong> Government Employment and Payroll was not conducteNOTESDetails may not add to totals due to independent roundingState and local employment statistics for years 1965 and later are significantly different from the data reported in the previous edition <strong>of</strong> the report because current data include employment for air,water and transit modes in addition to highway.Due to lack <strong>of</strong> data, employment for inland water transportation; pipeline transportation <strong>of</strong> crude oil; pipeline transportation <strong>of</strong> natural gas; other pipeline; scenic and sightseeing transportation forland, water and other; commercial air, rail, water transportation equipment rental and leasing; and regulation and administration <strong>of</strong> transportation programs are not reported.SOURCESAll data, except as noted:U.S. <strong>Department</strong> <strong>of</strong> Labor, Bureau <strong>of</strong> Labor Statistics Data,National Employment Hours and Earnings, available at http://www.bls.gov/data/ as <strong>of</strong> Nov. 1, 2010Government employment:<strong>US</strong>DOT:1970-75: U.S. <strong>Department</strong> <strong>of</strong> Commerce, Bureau <strong>of</strong> the Census, Statistical Abstract <strong>of</strong> the United States, 1976 (Washington, DC: 1976), table 409, and U.S. <strong>Department</strong> <strong>of</strong> <strong>Transportation</strong>, U.S.Coast Guard, G-WPM, Office <strong>of</strong> Military Personnel, personal communication.1980-85: U.S. <strong>Department</strong> <strong>of</strong> <strong>Transportation</strong>, Office <strong>of</strong> the Secretary <strong>of</strong> <strong>Transportation</strong>DOT Employment Facts, A Report to Management(Washington, DC: Annual issues).1990-2003: Ibid., DOT Workforce Demographics (Washington, DC : Annual issues).2004-09: Ibid., DOT Workforce Demographics, Demographics by Year, available at http://dothr.ost.dot.gov/workforceinfo/demographics.htm as <strong>of</strong> Nov. 1, 2010State and local:1960-91: U.S. <strong>Department</strong> <strong>of</strong> Commerce, Bureau <strong>of</strong> the Census, Statistical Abstract <strong>of</strong> the United States, 1993 (Washington, DC: 1993), table 500 and similar tables in earlier editions.1992-2009: Ibid., Government Employment and Payroll, available at http://www.census.gov/pub/govs/ as <strong>of</strong> Nov. 1, 2010
- Page 1:
NationalTransportationStatistics
- Page 4 and 5:
AcknowledgmentsU.S. Department of T
- Page 7 and 8:
Table of ContentsINTRODUCTIONTable
- Page 9 and 10:
1-56 U.S. Waterborne Freight (Updat
- Page 11 and 12:
SECTION E. RAILROAD2-39 Railroad an
- Page 13 and 14:
3-35 Transportation Expenditures by
- Page 15 and 16:
4-51 Air Pollution Trends in Select
- Page 18:
IntroductionCompiled and published
- Page 21:
SOURCESU.S. resident population, ag
- Page 25 and 26:
Table 1-1: System Mileage Within th
- Page 27 and 28:
Table 1-3: Number of U.S. Airports
- Page 29 and 30:
Table 1-5: U.S. Public Road and Str
- Page 31 and 32:
Table 1-7: Number of Stations Serve
- Page 33 and 34:
Table 1-9: ADA-Accessible Rail Tran
- Page 36:
Section BVehicle, Aircraft, andVess
- Page 39 and 40:
Table 1-12: U.S. Sales or Deliverie
- Page 41 and 42:
Table 1-14: U.S. Automobile and Tru
- Page 43 and 44:
Table 1-16: Retail a New Passenger
- Page 45 and 46:
Table 1-18: Retail Sales of New Car
- Page 47 and 48:
Table 1-20: Period Sales, Market Sh
- Page 49 and 50:
Table 1-22: Number of Trucks by Wei
- Page 51 and 52:
Taiwan U U U 116 132 124 101 113 11
- Page 53:
Section CCondition
- Page 56 and 57:
Table 1-26: Average Age of Automobi
- Page 58 and 59:
Table 1-28: Condition of U.S. Highw
- Page 60 and 61:
Table 1-30: Condition of Urban Bus
- Page 62 and 63:
Table 1-32: Class I Railroad Locomo
- Page 64 and 65:
Table 1-34: U.S. Flag Vessels by Ty
- Page 66 and 67:
Table 1-36: Roadway Vehicle-Miles T
- Page 68 and 69:
Table 1-38: Average Length of Haul,
- Page 70 and 71:
Table 1-40: U.S. Passenger-Miles (M
- Page 72 and 73:
Table 1-42: Long-Distance Travel in
- Page 74 and 75:
Table 1-43: Long-Distance Travel in
- Page 76 and 77:
Table 1-45: Air Passenger Travel Ar
- Page 79:
Section DTravel and GoodsMovement
- Page 82 and 83:
Table 1-48: U.S.-Mexican Border Lan
- Page 84 and 85:
Table 1-50: U.S. Ton-Miles of Freig
- Page 86 and 87:
Table 1-52: U.S.-Canadian Border La
- Page 88 and 89:
Table 1-54: U.S.-Mexican Border Lan
- Page 90 and 91:
Table 1-56: U.S. Waterborne Freight
- Page 92 and 93:
Table 1-58: Freight Activity in the
- Page 94 and 95:
Table 1-60: Value of U.S. Land Expo
- Page 96 and 97:
Table 1-61M: Crude Oil and Petroleu
- Page 98:
Table 1-63: U.S. Hazardous Material
- Page 102 and 103:
Table 1-64: Passengers Boarded and
- Page 104 and 105:
Table 1-66: Flight Operations Arriv
- Page 106 and 107:
Table 1-68: Major U.S. Air Carrier
- Page 108 and 109:
Table 1-69: Annual Person-Hours of
- Page 110 and 111:
Table 1-70: Travel Time IndexShort-
- Page 112 and 113:
Table 1-71: Annual Roadway Congesti
- Page 114:
Table 1-73: Amtrak On-Time Performa
- Page 118 and 119:
Table 2-1: Transportation Fatalitie
- Page 120 and 121:
Table 2-3: Transportation Accidents
- Page 122 and 123:
Table 2-5: Highway-Rail Grade-Cross
- Page 124 and 125:
Table 2-7: Transportation-Related O
- Page 127:
Section BAir
- Page 130 and 131:
Table 2-10: U.S. Commuter Air Carri
- Page 132 and 133:
Table 2-12: U.S. Commuter Air Carri
- Page 134 and 135:
Table 2-14: U.S. General Aviation a
- Page 136 and 137:
Table 2-16b: Prohibited Items Inter
- Page 139:
Section CHighway
- Page 142 and 143:
Table 2-18: Motor Vehicle Fatalitie
- Page 144 and 145:
Table 2-20: Occupant and Nonmotoris
- Page 146 and 147:
Table 2-22: Motorcycle Rider Safety
- Page 148 and 149:
Table 2-24: Bus Occupant Safety Dat
- Page 150 and 151:
Table 2-26: Fatalities by Highest B
- Page 152 and 153:
Table 2-28: Motor Vehicle Fatal Cra
- Page 154 and 155:
Table 2-30: Safety Belt and Motorcy
- Page 157:
Section DTransit
- Page 160 and 161:
Table 2-33: Transit Safety Data by
- Page 162 and 163:
d The number of Unlinked passenger
- Page 164 and 165:
Table 2-36: Transit and Grade-Cross
- Page 166 and 167:
Table 2-38: Reports of Violent Crim
- Page 168: KEY: N = data do not exist.a The ki
- Page 172 and 173: Table 2-39: Railroad and Grade-Cros
- Page 174 and 175: Table 2-41: Train Fatalities, Injur
- Page 176 and 177: Table 2-43: Railroad System Safety
- Page 178: Section FWater
- Page 181 and 182: Table 2-46: Waterborne Transportati
- Page 183 and 184: Table 2-48: Personal Watercraft Saf
- Page 186: Section GPipeline
- Page 190: Chapter 3Transportation andthe Econ
- Page 193 and 194: Table 3-2: U.S. Gross Domestic Prod
- Page 195 and 196: Table 3-4: U.S. Gross Domestic Prod
- Page 197 and 198: Table 3-6: U.S. Gross Domestic Dema
- Page 199 and 200: Table 3-8: Contributions to Gross D
- Page 201 and 202: Table 3-10: National Transportation
- Page 204 and 205: Table 3-11: Sales Price of Transpor
- Page 206 and 207: Table 3-13: Producer Price Indices
- Page 208 and 209: Table 3-15: Personal Expenditures b
- Page 210 and 211: Table 3-17: Average Cost of Owning
- Page 212: Table 3-19: Average Passenger Fares
- Page 216 and 217: Table 3-20: Average Passenger Reven
- Page 220 and 221: Table 3-24: Employment in Transport
- Page 222 and 223: Table 3-26: Median Weekly Earnings
- Page 224: Table 3-28: Labor Productivity Indi
- Page 228 and 229: Table 3-29: Federal, State, and Loc
- Page 230 and 231: Table 3-31: Summary of Transportati
- Page 232 and 233: Table 3-33: Transportation Revenues
- Page 234 and 235: Table 3-35: Transportation Expendit
- Page 236 and 237: Table 3-37: Federal Transportation
- Page 239: Chapter 4Transportation, Energy,and
- Page 242 and 243: Table 4-2: U.S. Consumption of Ener
- Page 245: Section BTransportation EnergyConsu
- Page 248 and 249: Table 4-5: Fuel Consumption by Mode
- Page 250 and 251: Table 4-7: Domestic Demand for Gaso
- Page 252 and 253: Table 4-9: Motor Vehicle Fuel Consu
- Page 254 and 255: Table 4-11: Light Duty Vehicle, Sho
- Page 256 and 257: Table 4-13: Single-Unit 2-Axle 6-Ti
- Page 258 and 259: Table 4-15: Bus Fuel Consumption an
- Page 260 and 261: Table 4-17: Class I Rail Freight Fu
- Page 262 and 263: Table 4-19: U.S. Government Energy
- Page 265 and 266: Table 4-20: Energy Intensity of Pas
- Page 267 and 268: Table 4-22: Energy Intensity of Lig
- Page 269 and 270:
Table 4-24: Energy Intensity of Tra
- Page 271 and 272:
Table 4-26: Energy Intensity of Amt
- Page 273 and 274:
Table 4-28: Annual Wasted Fuel Due
- Page 275 and 276:
Table 4-29: Annual Wasted Fuel Per
- Page 278:
Section DAir Pollution
- Page 281 and 282:
Table 4-31: Federal Exhaust Emissio
- Page 283 and 284:
1968-Table 4-33: Federal Exhaust Em
- Page 285 and 286:
Table 4-35: Federal Exhaust Emissio
- Page 287 and 288:
KEY: CO = carbon monoxide; HC = hyd
- Page 289 and 290:
Table 4-38: Federal Exhaust Emissio
- Page 291 and 292:
KEY: CO = carbon monoxide; g = gram
- Page 293 and 294:
KEY: bhp = brake horsepower; bhph =
- Page 295 and 296:
Table 4-42: Tier 2 Federal Exhaust
- Page 297 and 298:
Table 4-44: Estimated National Aver
- Page 299 and 300:
Table 4-46: Estimated National Emis
- Page 301 and 302:
Table 4-48: Estimated National Emis
- Page 303 and 304:
Table 4-50: Estimated National Emis
- Page 305 and 306:
Monmouth-Ocean, NJ 5 21 4 41 34 31
- Page 307 and 308:
Table 4-52: Areas in Nonattainment
- Page 310:
Section EWater Pollution, Noise,and
- Page 313 and 314:
Table 4-55: Leaking Underground Sto
- Page 315 and 316:
Table 4-57: Number of People Residi
- Page 318:
appendix aMetric ConversionTables
- Page 321 and 322:
Table 1-4M: Kilometers of Public Ro
- Page 323 and 324:
Table 1-35M: U.S. Vehicle-Kilometer
- Page 325 and 326:
Table 1-38M: Average Length of Haul
- Page 327 and 328:
a Includes freight, express, and ma
- Page 329 and 330:
Table 1-56M: U.S. Waterborne Freigh
- Page 331 and 332:
Table 4-3M: Domestic Demand for Ref
- Page 333 and 334:
Table 4-6M: Energy Consumption by M
- Page 335 and 336:
Table 4-8M: Certificated Air Carrie
- Page 337 and 338:
Table 4-11M: Light Duty Vehicle, Sh
- Page 339 and 340:
Table 4-13M: Single-Unit 2-Axle 6-T
- Page 341 and 342:
Table 4-15M: Bus Fuel Consumption a
- Page 343 and 344:
Table 4-17M: Class I Rail Freight F
- Page 345 and 346:
Table 4-19M: U.S. Government Energy
- Page 347 and 348:
Table 4-21M: Energy Intensity of Ce
- Page 349 and 350:
Table 4-23M: Average Fuel Efficienc
- Page 351 and 352:
Table 4-25M: Energy Intensity of Cl
- Page 353 and 354:
Appendix B: GlossaryAIR CARRIER: A
- Page 355 and 356:
Appendix B: GlossaryCOLLISION WITH
- Page 357 and 358:
Appendix B: GlossaryFEDERAL ENERGY
- Page 359 and 360:
Appendix B: GlossaryINJURY (Rail):
- Page 361 and 362:
Appendix B: GlossaryMOTOR BUS (Tran
- Page 363 and 364:
Appendix B: GlossaryPERSONAL BUSINE
- Page 365 and 366:
Appendix B: GlossarySUBCOMPACT CAR:
- Page 367 and 368:
appendix cAcronyms and InitialismsA
- Page 370:
appendix dModal Profiles
- Page 373 and 374:
Air Carrier Profile continuedPerfor
- Page 375 and 376:
Air Carrier Profile continuedPerfor
- Page 377 and 378:
Highway ProfileFINANCIAL 1960 1970
- Page 379 and 380:
General Aviation ProfileINVENTORY 1
- Page 381 and 382:
Motorcycle f f f f 50 50 50 50 50 5
- Page 383 and 384:
KEY: R = revised; U = data are unav
- Page 385 and 386:
Transit ProfileFINANCIAL 1960 1970
- Page 387 and 388:
161960-2006: Fatalities and Injured
- Page 389 and 390:
SAFETY d,9Number of fatalities, rai
- Page 391 and 392:
SAFETYFatalities in waterborne tran
- Page 393 and 394:
Natural Gas Pipeline ProfileFINANCI
- Page 395:
appendix eSource andAccuracy Statem
- Page 398 and 399:
agencies receiving funds through th
- Page 400 and 401:
solicitations of all federally regu
- Page 402 and 403:
Passenger Car, Truck, Bus, and Recr
- Page 404 and 405:
Highway, Total (registered vehicles
- Page 406 and 407:
after 1996. Some jurisdictions fail
- Page 408 and 409:
adherence to federal guidelines reg
- Page 410 and 411:
year. Also, expansion factors are u
- Page 412 and 413:
PassengerAir CarrierThe U.S. Depart
- Page 414 and 415:
The data are from Waterborne Commer
- Page 416 and 417:
The Transborder Surface Freight Dat
- Page 418 and 419:
A second data source for air-carrie
- Page 420 and 421:
Appendix EData Source and Accuracy
- Page 422 and 423:
when data are entered, they are che
- Page 424 and 425:
vehicles, and 15 were deleted becau
- Page 426 and 427:
TABLE 2-4. Distribution of Transpor
- Page 428 and 429:
BEA personal consumption expenditur
- Page 430 and 431:
Transportation-related government p
- Page 432 and 433:
information on their data collectio
- Page 434 and 435:
AccuracyAs in all surveys, the accu
- Page 436 and 437:
The American Public Transit Associa
- Page 438 and 439:
Government EmploymentThe Office of
- Page 440 and 441:
specifications or equations, should
- Page 442 and 443:
As mentioned above, the Highway Rev
- Page 444 and 445:
Highway ExpendituresFederal Highway
- Page 446 and 447:
consistency between the different m
- Page 448 and 449:
Appendix EData Source and Accuracy
- Page 450 and 451:
when data are entered, they are che
- Page 452 and 453:
vehicles, and 15 were deleted becau
- Page 454 and 455:
TABLE 2-4. Distribution of Transpor
- Page 456 and 457:
agencies receiving funds through th
- Page 458 and 459:
solicitations of all federally regu
- Page 460 and 461:
Passenger Car, Truck, Bus, and Recr
- Page 462 and 463:
Highway, Total (registered vehicles
- Page 464 and 465:
after 1996. Some jurisdictions fail
- Page 466 and 467:
adherence to federal guidelines reg
- Page 468 and 469:
year. Also, expansion factors are u
- Page 470 and 471:
PassengerAir CarrierThe U.S. Depart
- Page 472 and 473:
The data are from Waterborne Commer
- Page 474 and 475:
The Transborder Surface Freight Dat
- Page 476 and 477:
A second data source for air-carrie
- Page 478 and 479:
Appendix EData Source and Accuracy
- Page 480 and 481:
If transportation had been reviewed
- Page 482 and 483:
Alternative FuelsIn addition to oxy
- Page 484 and 485:
RailThe data are from Railroad Fact
- Page 486 and 487:
multiplied by the average peak peri
- Page 488 and 489:
In general, lead emissions are esti
- Page 490 and 491:
The number of the people exposed to
- Page 492 and 493:
Appendix EData Source and Accuracy
- Page 494 and 495:
If transportation had been reviewed
- Page 496 and 497:
Alternative FuelsIn addition to oxy
- Page 498 and 499:
RailThe data are from Railroad Fact
- Page 500 and 501:
multiplied by the average peak peri
- Page 502 and 503:
In general, lead emissions are esti
- Page 504 and 505:
The number of the people exposed to