

Acknowledgments US Department of Transportation - BTS
Acknowledgments US Department of Transportation - BTS
Acknowledgments US Department of Transportation - BTS

You also want an ePaper? Increase the reach of your titles
YUMPU automatically turns print PDFs into web optimized ePapers that Google loves.
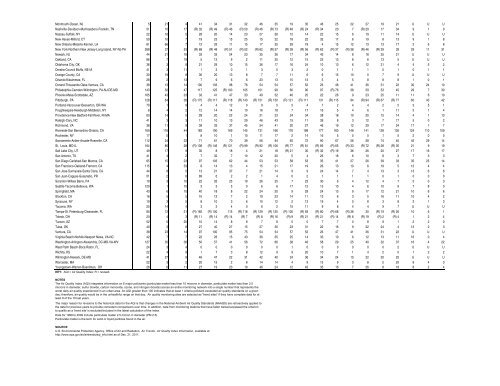
Monmouth-Ocean, NJ 5 21 4 41 34 31 32 46 35 19 35 46 25 22 27 19 21 U U UNashville-Davidson-Murfreesboro-Franklin, TN 51 10 17 (R) 32 (R) 49 (R) 46 (R) 50 (R) 46 (R) 73 (R) 48 (R) 24 (R) 34 20 7 (R) 29 17 34 9 1 9Nassau-Suffolk, NY 22 16 5 28 20 14 23 27 28 12 14 22 15 6 19 11 14 U U UNew Haven-Milford, CT 50 10 7 19 23 15 25 15 22 18 22 32 17 6 19 8 13 9 1 8New Orleans-Metairie-Kenner, LA 61 66 7 12 33 11 15 17 35 29 18 4 15 12 13 13 17 2 6 8New York-Northern New Jersey-Long Island, NY-NJ-PA 268 37 53 (R) 68 (R) 48 (R) 51 (R) 52 (R) 62 (R) 57 (R) 39 (R) 56 (R) 62 (R) 37 (R) 38 (R) 46 (R) 39 39 29 11 31Newark, NJ 44 21 16 33 33 24 23 35 36 17 34 43 14 8 18 25 21 U U UOakland, CA 86 7 19 5 13 9 2 11 20 12 15 23 13 8 6 13 5 U U UOklahoma City, OK 36 3 8 21 29 10 15 36 17 16 24 10 13 6 12 31 4 4 5 2Omaha-Council Bluffs, NE-IA 41 3 11 1 3 0 1 3 5 3 2 0 1 1 1 0 1 0 1 1Orange County, CA 30 19 8 30 20 13 8 7 7 11 6 6 15 10 0 7 9 U U UOrlando-Kissimmee, FL 28 2 13 7 9 6 6 23 13 15 13 5 4 5 8 8 8 1 0 1Oxnard-Thousands Oaks-Ventura, CA 38 13 14 100 103 98 76 54 54 57 52 26 48 41 36 31 22 30 24 10Philadelphia-Camden-Wilmington, PA-NJ-DE-MD 143 32 47 117 125 (R) 100 105 101 99 60 90 97 (R) 76 38 59 53 45 29 7 30Phoenix-Mesa-Scottsdale, AZ 165 43 23 33 41 47 33 49 52 46 25 22 26 9 23 25 11 11 6 10Pittsburgh, PA 128 64 38 (R) 175 (R) 117 (R) 118 (R) 143 (R) 151 (R) 150 (R) 121 (R) 111 131 (R) 115 94 (R) 94 (R) 67 (R) 77 60 43 42Portland-Vancouver-Beaverton, OR-WA 70 1 9 4 4 12 0 9 5 5 4 7 2 4 4 2 5 3 5 1Poughkeepsie-Newburgh-Middleton, NY 8 4 2 12 14 14 10 16 18 7 17 16 5 4 6 1 11 5 1 4Providence-New Bedford-Fall River, RI-MA 63 14 5 28 20 22 24 21 23 24 34 38 18 10 20 15 14 4 1 13Raleigh-Cary, NC 41 3 3 11 10 13 29 46 43 15 11 39 8 3 12 7 17 5 0 2Richmond, VA 38 11 9 39 33 37 45 54 41 20 27 46 19 12 29 17 24 17 1 7Riverside-San Bernardino-Ontario, CA 169 116 44 183 190 169 145 131 166 176 188 177 160 148 141 128 135 124 110 109Rochester, NY 17 0 1 8 10 1 10 11 17 2 14 16 5 0 0 1 5 2 0 0Sacramento-Arden-Arcade-Roseville, CA 112 24 22 71 61 70 39 56 94 65 72 90 67 56 58 74 40 45 29 14St, Louis, MO-IL 164 86 28 (R) 138 (R) 146 (R) 121 (R) 99 (R) 92 (R) 106 (R) 77 (R) 81 (R) 85 (R) 65 (R) 33 (R) 72 (R) 28 (R) 35 21 9 19Salt Lake City, UT 49 17 9 30 8 18 4 21 18 (R) 21 30 (R) 32 (R) 19 36 26 20 27 17 16 17San Antonio, TX 41 4 2 7 32 7 10 12 20 5 4 26 18 6 10 8 3 7 3 3San Diego-Carlsbad-San Marcos, CA 65 15 23 97 103 62 44 53 53 58 53 35 41 27 26 39 33 35 25 14San Francisco-Oakland-Fremont, CA 115 4 33 8 14 13 4 15 21 17 19 26 13 10 6 19 5 12 4 4San Jose-Sunnyvale-Santa Clara, CA 44 8 5 13 21 37 7 21 14 9 9 24 14 7 4 13 3 13 6 6San Juan-Caguas-Guaynabo, PR 51 2 6 89 6 2 2 1 4 0 2 1 1 1 1 0 1 0 0 0Scranton-Wilkes Barre, PA 19 3 10 22 26 25 19 26 25 7 23 30 6 4 12 4 7 5 0 3Seattle-Tacoma-Bellevue, WA 120 1 10 3 3 5 0 6 6 17 12 13 10 4 6 10 9 7 8 0Springfield, MA 43 6 10 40 18 8 22 24 20 9 29 24 13 9 17 12 21 10 6 6Stockton, CA 16 5 5 10 12 7 2 19 23 14 11 13 6 3 5 16 11 10 4 2Syracuse, NY 19 3 5 8 10 3 6 10 12 2 13 19 4 0 8 3 8 3 1 3Tacoma, WA 25 14 4 3 3 4 0 6 2 15 11 9 8 4 4 9 7 U U UTampa-St. Petersburg-Clearwater, FL 80 12 21 (R) 160 (R) 100 115 (R) 118 (R) 129 (R) 125 (R) 100 (R) 93 (R) 80 (R) 68 (R) 36 30 (R) 19 (R) 26 10 6 1Toledo, OH 20 4 3 (R) 11 (R) 14 (R) 14 (R) 7 (R) 8 (R) 16 (R) 9 (R) 21 (R) 21 (R) 14 (R) 6 (R) 19 (R) 2 (R) 4 1 2 4Tucson, AZ 52 0 20 10 14 8 8 7 8 5 0 7 7 0 8 9 1 2 2 0Tulsa, OK 40 3 8 27 40 27 15 27 30 23 31 22 16 9 22 24 4 13 2 3Ventura, CA 38 23 14 97 100 95 75 54 54 57 52 26 47 41 36 31 22 U U UVirginia Beach-Norfolk-Newport News, VA-NC 42 7 7 22 26 15 43 36 35 25 14 33 10 6 12 13 11 16 0 4Washington-Arlington-Alexandria, DC-MD-VA-WV 127 35 36 50 57 41 56 72 66 38 46 58 29 25 40 32 37 16 4 22West Palm Beach-Boca Raton, FL 24 3 4 0 0 0 0 0 0 1 0 0 0 0 0 0 2 U U UWichita, KS 22 4 9 1 7 3 8 12 9 9 20 10 7 1 4 2 0 1 2 2Wilmington-Newark, DE-MD 41 27 9 46 47 22 31 42 40 24 36 34 24 10 22 20 25 U U UWorcester, MA 22 3 2 20 15 2 8 14 14 4 9 15 9 3 8 5 20 8 4 3Youngstown-Warren-Boardman, OH 26 6 11 27 19 23 19 46 24 12 45 35 16 7 26 8 18 8 2 4KEY: AQI = Air Quality Index; R = revised.NOTESThe Air Quality Index (AQI) integrates information on 6 major pollutants (particulate matter less than 10 microns in diameter, particulate matter less than 2.5microns in diameter, sulfur dioxide, carbon monoxide, ozone, and nitrogen dioxide) across an entire monitoring network into a single number that represents theworst daily air quality experienced in an urban area. An AQI greater than 100 indicates that at least 1 criteria pollutant exceeded air quality standards on a givenday; therefore, air quality would be in the unhealthful range on that day. Air quality monitoring sites are selected as "trend sites" if they have complete data for atleast 8 <strong>of</strong> the 10 last years.The major reason for revisions to the historical data for the AQI is that changes in the National Ambient Air Quality Standards (NAAQS) are retroactively applied tothe data for previous years to provide consistent comparisons over time. In addition, data from monitoring stations that have fallen below/surpassed the criterionto qualify as a 'trend site' is excluded/included in the latest calculation <strong>of</strong> the index.Data for 1999 to 2009 include particulate matter 2.5 micron in diameter (PM 2.5).Particulate matter is the term for solid or liquid particles found in the air.SOURCEU.S. Environmental Protection Agency, Office <strong>of</strong> Air and Radiation, Air Trends , Air Quality Index Information, available athttp://www.epa.gov/air/airtrends/aqi_info.html as <strong>of</strong> Dec. 21, 2011.


