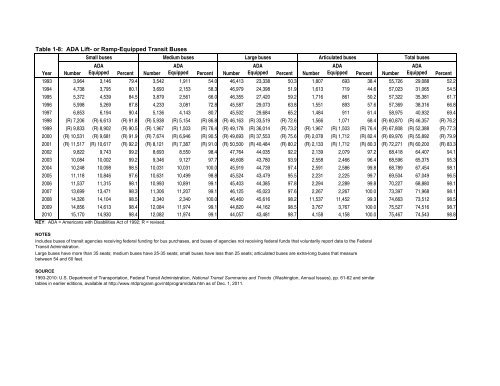
Table 1-8: ADA Lift- or Ramp-Equipped Transit BusesSmall buses Medium buses Large buses Articulated busesYearNumberADAEquipped Percent NumberADAEquipped Percent NumberADAEquipped Percent NumberADAEquipped Percent NumberTotal busesADAEquipped1993 3,964 3,146 79.4 3,542 1,911 54.0 46,413 23,338 50.3 1,807 693 38.4 55,726 29,088 52.21994 4,738 3,795 80.1 3,693 2,153 58.3 46,979 24,398 51.9 1,613 719 44.6 57,023 31,065 54.51995 5,372 4,539 84.5 3,879 2,561 66.0 46,355 27,420 59.2 1,716 861 50.2 57,322 35,381 61.71996 5,998 5,269 87.8 4,233 3,081 72.8 45,587 29,073 63.8 1,551 893 57.6 57,369 38,316 66.81997 6,853 6,194 90.4 5,136 4,143 80.7 45,502 29,684 65.2 1,484 911 61.4 58,975 40,932 69.41998 (R) 7,206 (R) 6,613 (R) 91.8 (R) 5,938 (R) 5,154 (R) 86.8 (R) 46,163 (R) 33,519 (R) 72.6 1,566 1,071 68.4 (R) 60,870 (R) 46,357 (R) 76.21999 (R) 9,833 (R) 8,902 (R) 90.5 (R) 1,967 (R) 1,503 (R) 76.4 (R) 49,178 (R) 36,014 (R) 73.2 (R) 1,967 (R) 1,503 (R) 76.4 (R) 67,808 (R) 52,388 (R) 77.32000 (R) 10,531 (R) 9,681 (R) 91.9 (R) 7,674 (R) 6,946 (R) 90.5 (R) 49,693 (R) 37,553 (R) 75.6 (R) 2,078 (R) 1,712 (R) 82.4 (R) 69,976 (R) 55,892 (R) 79.92001 (R) 11,517 (R) 10,617 (R) 92.2 (R) 8,121 (R) 7,387 (R) 91.0 (R) 50,500 (R) 40,484 (R) 80.2 (R) 2,133 (R) 1,712 (R) 80.3 (R) 72,271 (R) 60,200 (R) 83.32002 9,822 9,743 99.2 8,693 8,550 98.4 47,764 44,035 92.2 2,139 2,079 97.2 68,418 64,407 94.12003 10,084 10,002 99.2 9,346 9,127 97.7 46,608 43,780 93.9 2,558 2,466 96.4 68,596 65,375 95.32004 10,248 10,098 98.5 10,031 10,031 100.0 45,919 44,739 97.4 2,591 2,586 99.8 68,789 67,454 98.12005 11,118 10,846 97.6 10,631 10,499 98.8 45,524 43,479 95.5 2,231 2,225 99.7 69,504 67,049 96.52006 11,537 11,315 98.1 10,993 10,891 99.1 45,403 44,385 97.8 2,294 2,289 99.8 70,227 68,880 98.12007 13,699 13,471 98.3 11,306 11,207 99.1 46,125 45,023 97.6 2,267 2,267 100.0 73,397 71,968 98.12008 14,326 14,104 98.5 2,340 2,340 100.0 46,460 45,616 98.2 11,537 11,452 99.3 74,663 73,512 98.52009 14,856 14,613 98.4 12,084 11,974 99.1 44,820 44,162 98.5 3,767 3,767 100.0 75,527 74,516 98.72010 15,170 14,930 98.4 12,082 11,974 99.1 44,057 43,481 98.7 4,158 4,158 100.0 75,467 74,543 98.8KEY: ADA = Americans with Disabilities Act <strong>of</strong> 1992; R = revised.PercentNOTESIncludes buses <strong>of</strong> transit agencies receiving federal funding for bus purchases, and buses <strong>of</strong> agencies not receiving federal funds that voluntarily report data to the FederalTransit Administration.Large buses have more than 35 seats; medium buses have 25-35 seats; small buses have less than 25 seats; articulated buses are extra-long buses that measurebetween 54 and 60 feet.SOURCE1993-2010: U.S. <strong>Department</strong> <strong>of</strong> <strong>Transportation</strong>, Federal Transit Administration, National Transit Summaries and Trends (Washington, Annual Issues), pp. 61-62 and similartables in earlier editions, available at http://www.ntdprogram.gov/ntdprogram/data.htm as <strong>of</strong> Dec. 1, 2011.
Table 1-9: ADA-Accessible Rail Transit Stations by AgencyNumber <strong>of</strong> stationsPercent <strong>of</strong> Stations Not ADA-AccessibleType <strong>of</strong> rail transit / agency Primary city served 1996 1997 1998 1999 2000 2001 2002 2003 2004 2005 2006 2007 2008 2009 2010 1996 1997 1998 1999 2000 2001 2002 2003 2004 2005 2006 2007 2008 2009 2010Heavy railSan Francisco Bay Area Rapid Transit District San Francisco, CA 36 39 39 39 39 39 39 43 43 43 43 43 43 43 43 0.0 0.0 0.0 0.0 0.0 0.0 0.0 0.0 0.0 0.0 0.0 0.0 0.0 0.0 0.0Los Angeles County Metropolitan <strong>Transportation</strong> Authority Los Angeles, CA 5 8 8 13 16 16 16 16 16 16 16 16 16 16 16 0.0 0.0 0.0 0.0 0.0 0.0 0.0 0.0 0.0 0.0 0.0 0.0 0.0 0.0 0.0Washington Metropolitan Area Transit Authority Washington, DC 74 75 75 76 78 83 83 83 83 86 86 86 86 86 86 0.0 0.0 0.0 0.0 0.0 0.0 0.0 0.0 0.0 0.0 0.0 0.0 0.0 0.0 0.0Miami-Dade Transit Miami, FL 21 21 21 21 21 21 21 22 22 22 20 22 22 22 22 100.0 100.0 100.0 100.0 100.0 100.0 0.0 0.0 0.0 0.0 0.0 0.0 0.0 0.0 0.0Metropolitan Atlanta Rapid Transit Authority Atlanta, GA 36 36 36 36 36 38 38 38 38 38 38 38 38 38 38 0.0 0.0 0.0 0.0 0.0 0.0 0.0 0.0 0.0 0.0 0.0 0.0 0.0 0.0 0.0Chicago Transit Authority Chicago, IL 140 141 141 142 142 144 144 144 144 144 144 144 143 143 143 100.0 100.0 100.0 90.1 62.0 55.6 55.6 54.2 50.0 50.0 47.9 44.4 39.9 37.8 37.1Massachusetts Bay <strong>Transportation</strong> Authority Boston, MA 53 53 53 53 53 53 53 53 53 53 53 53 53 53 53 37.7 37.7 37.7 30.2 30.2 28.3 24.5 20.8 20.8 20.8 20.8 7.5 7.5 7.5 7.5Maryland Transit Administration Baltimore, MD 14 14 14 14 14 14 14 14 14 14 14 14 14 14 14 0.0 0.0 0.0 0.0 0.0 0.0 0.0 0.0 0.0 0.0 0.0 0.0 0.0 0.0 0.0Metropolitan <strong>Transportation</strong> Authority New York City Transit New York, NY 468 468 468 468 468 468 468 468 468 468 468 468 468 468 468 94.0 93.6 93.6 93.4 91.2 91.2 90.6 89.3 88.5 86.1 85.3 84.0 82.9 82.3 81.2Port Authority Trans-Hudson Corporation New York, NY 13 13 13 13 13 13 11 13 13 13 13 13 13 13 13 53.8 53.8 53.8 53.8 53.8 53.8 54.5 46.2 46.2 46.2 46.2 46.2 46.2 46.2 46.2Metropolitan <strong>Transportation</strong> Authority Staten Island Railway New York, NY 22 22 22 22 22 23 23 23 23 23 23 23 23 23 23 90.9 90.9 90.9 90.9 90.9 87.0 82.6 82.6 82.6 78.3 78.3 78.3 78.3 78.3 78.3The Greater Cleveland Regional Transit Authority Cleveland, OH 18 18 18 18 18 18 18 18 18 18 18 18 18 18 18 77.8 66.7 66.7 61.1 55.6 55.6 50.0 50.0 44.4 44.4 33.3 27.8 27.8 27.8 27.8Southeastern Pennsylvania <strong>Transportation</strong> Authority Philadelphia, PA 76 76 76 76 76 76 53 75 75 75 75 75 75 75 75 94.7 94.7 94.7 94.7 94.7 94.7 75.5 77.3 76.0 76.0 76.0 68.0 62.7 61.3 60.0Port Authority Transit Corporation Philadelphia, PA 13 13 13 13 13 13 13 13 13 13 13 13 13 13 13 76.9 76.9 61.5 61.5 61.5 61.5 61.5 61.5 61.5 61.5 61.5 61.5 61.5 61.5 61.5Commuter railAltamont Commuter Express San Jose, CA U U U U U U 10 10 10 10 10 10 10 10 10 NA NA NA NA NA NA 0.0 0.0 0.0 0.0 0.0 0.0 0.0 0.0 0.0North San Diego County Transit District San Diego, CA U U U U U U 8 8 8 8 8 8 8 8 8 NA NA NA NA NA NA 0.0 0.0 0.0 0.0 0.0 0.0 0.0 0.0 0.0Peninsula Corridor Joint Powers Board San Francisco, CA U U U U U U 34 34 34 33 32 32 32 32 32 NA NA NA NA NA NA 35.3 29.4 29.4 27.3 28.1 25.0 21.9 18.8 18.8Southern California Regional Rail Authority Los Angeles, CA U 45 46 46 47 49 51 53 53 54 54 54 55 55 55 NA 0.0 0.0 0.0 0.0 0.0 0.0 0.0 0.0 0.0 0.0 0.0 0.0 0.0 0.0Connecticut <strong>Department</strong> <strong>of</strong> <strong>Transportation</strong> New Haven, CT U U U U U U 8 8 8 8 8 8 8 9 9 NA NA NA NA NA NA 0.0 0.0 0.0 0.0 0.0 0.0 0.0 11.1 11.1Virginia Railway Express Washington, DC U U U U U U 18 18 18 18 18 18 18 18 18 NA NA NA NA NA NA 0.0 0.0 0.0 0.0 0.0 0.0 0.0 0.0 0.0South Florida Regional <strong>Transportation</strong> Authority Miami, FL U U U U U U 18 18 18 18 18 18 18 18 18 NA NA NA NA NA NA 0.0 0.0 0.0 0.0 0.0 0.0 0.0 0.0 0.0Northeast Illinois Regional Commuter Railroad Corporation Chicago, IL 226 226 226 227 227 227 227 227 230 231 238 239 239 240 240 59.7 54.0 54.0 51.1 49.3 44.9 42.3 41.0 39.6 37.2 33.2 31.8 31.0 30.0 29.6Northern Indiana Commuter <strong>Transportation</strong> District Chicago, IL 18 18 18 18 18 18 20 20 20 20 20 20 20 20 20 61.1 61.1 61.1 61.1 61.1 61.1 45.0 45.0 40.0 40.0 35.0 35.0 35.0 35.0 35.0Massachusetts Bay <strong>Transportation</strong> Authority Boston, MA U U 117 119 120 121 124 125 126 126 126 126 133 133 133 NA NA 42.7 (R) 42.0 38.3 38.0 37.1 35.2 34.9 34.9 33.3 30.2 28.6 28.6 27.8Maryland Transit Administration Baltimore, MD U U U U U U 42 42 42 42 42 42 42 42 42 NA NA NA NA NA NA 47.6 47.6 47.6 47.6 47.6 42.9 42.9 42.9 42.9Northern New England Passenger Rail Authority (NNEPRA) Portland, ME NA NA NA NA NA NA NA NA NA NA NA 10 10 10 10 NA NA NA NA NA NA NA NA NA NA NA 0.0 0.0 0.0 0.0Metro Transit Minneapolis/St. Cloud, MN NA NA NA NA NA NA NA NA NA NA NA NA NA 6 6 NA NA NA NA NA NA NA NA NA NA NA NA NA 0.0 0.0Rio Metro Regional Transit District Albuquerque/Santa Fe, NM NA NA NA NA NA NA NA NA NA NA NA NA NA 10 12 NA NA NA NA NA NA NA NA NA NA NA NA NA 0.0 0.0New Jersey Transit Corporation New York, NY 158 158 158 162 162 162 167 168 167 167 162 162 164 164 164 86.1 86.1 74.1 71.6 71.6 71.6 69.5 69.0 59.3 59.3 58.6 58.6 57.3 57.3 56.1Metropolitan <strong>Transportation</strong> Authority Long Island Rail Road New York, NY 134 134 124 124 124 124 124 124 124 124 124 124 124 124 124 88.8 88.8 29.0 21.8 21.8 21.8 20.2 20.2 20.2 20.2 20.2 20.2 19.4 16.1 16.9Metropolitan <strong>Transportation</strong> Authority Metro-North Railroad New York, NY 106 106 106 106 108 108 109 109 109 109 109 109 109 110 110 84.0 82.1 81.1 81.1 81.5 74.1 73.4 70.6 70.6 70.6 65.1 65.1 61.5 60.9 60.9Pennsylvania <strong>Department</strong> <strong>of</strong> <strong>Transportation</strong> Pennsylvania, PA U U U U U U 14 12 12 12 12 12 12 12 12 NA NA NA NA NA NA 71.4 66.7 66.7 66.7 66.7 66.7 66.7 66.7 66.7Southeastern Pennsylvania <strong>Transportation</strong> Authority Philadelphia, PA 181 177 177 177 177 177 153 156 156 156 156 156 154 154 154 86.2 83.1 83.1 83.1 83.1 83.1 68.6 67.3 67.3 65.4 64.7 64.7 64.3 64.3 64.3Regional Transity Authority (RTA) Nashville, TN NA NA NA NA NA NA NA NA NA NA NA 6 6 6 6 NA NA NA NA NA NA NA NA NA NA NA 0.0 0.0 0.0 0.0Capital Metropolitan <strong>Transportation</strong> Austin, TX NA NA NA NA NA NA NA NA NA NA NA NA NA NA 9 NA NA NA NA NA NA NA NA NA NA NA NA NA NA 0.0Dallas Area Rapid Transit Dallas, TX U U U U U U 4 4 4 4 4 4 4 5 10 NA NA NA NA NA NA 0.0 0.0 0.0 0.0 0.0 0.0 0.0 0.0 0.0Fort Worth <strong>Transportation</strong> Authority Fort Worth,TX U U U U U U 5 5 5 5 5 5 5 5 U NA NA NA NA NA NA 0.0 0.0 0.0 0.0 0.0 0.0 0.0 0.0 UUtah Transit Authority Salt Lake City, UT NA NA NA NA NA NA NA NA NA NA NA NA 8 8 8 NA NA NA NA NA NA NA NA NA NA NA NA 0.0 0.0 0.0Central Puget Sound Regional Transit Authority Seattle, WA U U U U U U 7 9 9 9 9 9 10 10 10 NA NA NA NA NA NA 0.0 0.0 0.0 0.0 0.0 0.0 0.0 0.0 0.0Light railValley Metro Rail Phoenix, AZ NA NA NA NA NA NA NA NA NA NA NA NA NA 33 33 NA NA NA NA NA NA NA NA NA NA NA NA NA 0.0 0.0Los Angeles County Metropolitan <strong>Transportation</strong> Authority Los Angeles, CA 36 36 36 36 36 36 36 36 49 49 49 49 49 49 53 0.0 0.0 0.0 0.0 0.0 0.0 0.0 0.0 0.0 0.0 0.0 0.0 0.0 0.0 0.0North County Transit District San Diego, CA NA NA NA NA NA NA NA NA NA NA NA NA 15 15 15 NA NA NA NA NA NA NA NA NA NA NA NA 0.0 0.0 0.0San Francisco Municipal Railway San Francisco, CA 11 11 11 11 11 11 9 9 9 9 9 9 9 9 9 100.0 100.0 100.0 100.0 100.0 100.0 0.0 0.0 0.0 0.0 0.0 0.0 0.0 0.0 0.0Sacramento Regional Transit District Sacramento, CA 28 28 28 29 29 29 29 31 41 41 41 48 48 48 48 100.0 100.0 100.0 0.0 0.0 0.0 0.0 3.2 2.4 2.4 2.4 2.1 2.1 2.1 2.1San Diego Trolley, Inc. San Diego, CA 38 41 49 49 49 49 49 49 49 49 53 53 53 53 U 0.0 0.0 0.0 0.0 0.0 0.0 2.0 2.0 2.0 2.0 0.0 0.0 0.0 0.0 <strong>US</strong>anta Clara Valley <strong>Transportation</strong> Authority San Jose, CA 33 34 34 34 47 49 44 44 57 57 65 65 65 65 65 84.8 85.3 85.3 85.3 55.3 53.1 0.0 0.0 0.0 0.0 0.0 0.0 0.0 0.0 0.0Denver Regional <strong>Transportation</strong> District Denver, CO 15 15 15 15 20 20 20 24 23 23 36 36 36 36 36 0.0 0.0 0.0 0.0 0.0 0.0 0.0 0.0 0.0 0.0 0.0 0.0 0.0 0.0 0.0Hillsborough Area Regional Transit Authority Tampa-St. Petersburg, FL NA NA NA NA NA NA NA 8 8 8 8 8 8 8 8 NA NA NA NA NA NA NA 0.0 0.0 0.0 0.0 0.0 0.0 0.0 0.0New Orleans Regional Transit Authority New Orleans, LA 2 9 9 9 9 9 9 9 9 NA 9 9 9 9 9 0.0 0.0 0.0 0.0 0.0 0.0 0.0 0.0 0.0 NA 0.0 0.0 0.0 0.0 0.0Massachusetts Bay <strong>Transportation</strong> Authority Boston, MA 95 95 95 95 95 78 78 70 70 70 70 74 74 74 74 90.5 90.5 90.5 87.4 87.4 79.5 79.5 64.3 64.3 64.3 64.3 62.2 62.2 52.7 51.4Maryland Transit Administration Baltimore, MD 24 24 32 32 32 32 32 32 32 33 33 33 33 33 33 0.0 0.0 0.0 0.0 0.0 0.0 0.0 0.0 0.0 0.0 0.0 0.0 0.0 0.0 0.0City <strong>of</strong> Detroit <strong>Department</strong> <strong>of</strong> <strong>Transportation</strong> Detroit, MI NA NA NA NA NA 8 8 8 NA NA NA NA NA NA NA NA NA NA NA NA 100.0 100.0 100.0 NA NA NA NA NA NA NAMetro Transit Minneapolis, MN NA NA NA NA NA NA NA NA NA NA NA 17 17 19 19 NA NA NA NA NA NA NA NA NA NA NA 47.1 0.0 0.0 0.0Bi-State Development Agency St. Louis, MO 18 18 18 18 18 26 26 28 28 28 28 37 37 37 37 0.0 0.0 0.0 0.0 0.0 0.0 0.0 0.0 0.0 0.0 0.0 0.0 0.0 0.0 0.0Charlotte Area Transit System Charlotte, NC NA NA NA NA NA NA NA NA NA NA NA NA 19 19 19 NA NA NA NA NA NA NA NA NA NA NA NA 0.0 0.0 0.0New Jersey Transit Corporation Newark, NJ 11 11 11 11 11 11 26 27 49 52 52 60 60 60 60 100.0 100.0 100.0 100.0 100.0 100.0 42.3 44.4 14.3 13.5 13.5 10.0 10.0 10.0 10.0Niagara Frontier <strong>Transportation</strong> Authority Buffalo, NY 14 14 14 14 14 14 15 15 15 15 15 15 15 15 15 50.0 50.0 50.0 50.0 50.0 50.0 53.3 53.3 53.3 53.3 53.3 53.3 0.0 0.0 0.0The Greater Cleveland Regional Transit Authority Cleveland, OH 33 33 33 34 34 34 34 34 34 34 34 34 34 34 34 93.9 84.8 84.8 79.4 79.4 76.5 76.5 76.5 76.5 76.5 76.5 73.5 73.5 73.5 73.5Tri-County Metropolitan <strong>Transportation</strong> District <strong>of</strong> Oregon Portland, OR 27 27 29 47 47 47 52 52 62 63 63 63 30 30 38 3.7 3.7 3.4 2.1 2.1 2.1 0.0 0.0 0.0 0.0 0.0 0.0 0.0 0.0 0.0Port Authority <strong>of</strong> Allegheny County Pittsburgh, PA 13 13 13 13 13 13 14 14 25 25 25 25 27 23 23 100.0 0.0 0.0 0.0 0.0 0.0 0.0 0.0 0.0 0.0 0.0 0.0 0.0 0.0 0.0Southeastern Pennsylvania <strong>Transportation</strong> Authority Philadelphia, PA 64 64 64 64 64 64 68 46 46 46 46 45 45 45 45 100.0 100.0 100.0 100.0 100.0 100.0 95.6 100.0 97.8 97.8 97.8 97.8 95.6 95.6 95.6Memphis Area Transit Authority Memphis, TN 20 20 27 28 28 28 28 1 7 7 7 7 7 7 7 0.0 0.0 0.0 0.0 0.0 0.0 0.0 0.0 0.0 0.0 0.0 0.0 0.0 0.0 0.0Dallas Area Rapid Transit Dallas, TX 14 20 20 20 20 22 29 34 34 34 34 34 34 39 39 0.0 0.0 0.0 0.0 0.0 0.0 0.0 0.0 0.0 0.0 0.0 0.0 0.0 0.0 0.0Island Transit Galveston, TX 3 3 3 U U U 3 3 3 3 3 3 U U U 0.0 0.0 0.0 NA NA NA 0.0 0.0 0.0 0.0 0.0 0.0 U U UMetropolitan Transit Authority <strong>of</strong> Harris County Houston, TX NA NA NA NA NA NA NA NA 16 16 16 16 16 16 16 NA NA NA NA NA NA NA NA 0.0 0.0 0.0 0.0 0.0 0.0 0.0Utah Transit Authority Salt Lake City, UT NA NA NA 16 16 20 20 23 23 24 25 25 28 28 28 NA NA NA 0.0 0.0 0.0 0.0 0.0 0.0 0.0 0.0 0.0 0.0 0.0 0.0Central Puget Sound Regional Transit Authority Seattle, WA NA NA NA NA NA NA NA 6 6 6 6 6 6 19 19 NA NA NA NA NA NA NA 0.0 0.0 0.0 0.0 0.0 0.0 0.0 0.0King County <strong>Department</strong> <strong>of</strong> <strong>Transportation</strong> Seattle, WA 14 14 14 9 9 9 9 9 9 9 9 NA 11 11 11 0.0 0.0 0.0 0.0 0.0 0.0 0.0 0.0 0.0 0.0 0.0 NA 0.0 0.0 0.0Kenosha Transit Kenosha, WI NA NA NA NA 1 1 2 2 2 2 2 2 2 2 2 NA NA NA NA 100.0 100.0 50.0 50.0 50.0 50.0 50.0 50.0 50.0 50.0 50.0KEY: ADA = Americans with Disabilities Act <strong>of</strong> 1992; NA = not applicable; U = data are unavailable.NOTESRail transit data for 2002 and beyond include both directly operated and purchased transportation. Prior to 2002, the data include directly operated service only.Stations for U.S. territories are excluded.SOURCEU.S. <strong>Department</strong> <strong>of</strong> <strong>Transportation</strong>, Federal Transit Administration, National Transit Database (Washington, DC: Annual Issues), table 21, available athttp://www.ntdprogram.gov as <strong>of</strong> Dec. 13, 2011.
- Page 1: NationalTransportationStatistics
- Page 4 and 5: AcknowledgmentsU.S. Department of T
- Page 7 and 8: Table of ContentsINTRODUCTIONTable
- Page 9 and 10: 1-56 U.S. Waterborne Freight (Updat
- Page 11 and 12: SECTION E. RAILROAD2-39 Railroad an
- Page 13 and 14: 3-35 Transportation Expenditures by
- Page 15 and 16: 4-51 Air Pollution Trends in Select
- Page 18: IntroductionCompiled and published
- Page 21: SOURCESU.S. resident population, ag
- Page 25 and 26: Table 1-1: System Mileage Within th
- Page 27 and 28: Table 1-3: Number of U.S. Airports
- Page 29 and 30: Table 1-5: U.S. Public Road and Str
- Page 31: Table 1-7: Number of Stations Serve
- Page 36: Section BVehicle, Aircraft, andVess
- Page 39 and 40: Table 1-12: U.S. Sales or Deliverie
- Page 41 and 42: Table 1-14: U.S. Automobile and Tru
- Page 43 and 44: Table 1-16: Retail a New Passenger
- Page 45 and 46: Table 1-18: Retail Sales of New Car
- Page 47 and 48: Table 1-20: Period Sales, Market Sh
- Page 49 and 50: Table 1-22: Number of Trucks by Wei
- Page 51 and 52: Taiwan U U U 116 132 124 101 113 11
- Page 53: Section CCondition
- Page 56 and 57: Table 1-26: Average Age of Automobi
- Page 58 and 59: Table 1-28: Condition of U.S. Highw
- Page 60 and 61: Table 1-30: Condition of Urban Bus
- Page 62 and 63: Table 1-32: Class I Railroad Locomo
- Page 64 and 65: Table 1-34: U.S. Flag Vessels by Ty
- Page 66 and 67: Table 1-36: Roadway Vehicle-Miles T
- Page 68 and 69: Table 1-38: Average Length of Haul,
- Page 70 and 71: Table 1-40: U.S. Passenger-Miles (M
- Page 72 and 73: Table 1-42: Long-Distance Travel in
- Page 74 and 75: Table 1-43: Long-Distance Travel in
- Page 76 and 77: Table 1-45: Air Passenger Travel Ar
- Page 79: Section DTravel and GoodsMovement
- Page 82 and 83:
Table 1-48: U.S.-Mexican Border Lan
- Page 84 and 85:
Table 1-50: U.S. Ton-Miles of Freig
- Page 86 and 87:
Table 1-52: U.S.-Canadian Border La
- Page 88 and 89:
Table 1-54: U.S.-Mexican Border Lan
- Page 90 and 91:
Table 1-56: U.S. Waterborne Freight
- Page 92 and 93:
Table 1-58: Freight Activity in the
- Page 94 and 95:
Table 1-60: Value of U.S. Land Expo
- Page 96 and 97:
Table 1-61M: Crude Oil and Petroleu
- Page 98:
Table 1-63: U.S. Hazardous Material
- Page 102 and 103:
Table 1-64: Passengers Boarded and
- Page 104 and 105:
Table 1-66: Flight Operations Arriv
- Page 106 and 107:
Table 1-68: Major U.S. Air Carrier
- Page 108 and 109:
Table 1-69: Annual Person-Hours of
- Page 110 and 111:
Table 1-70: Travel Time IndexShort-
- Page 112 and 113:
Table 1-71: Annual Roadway Congesti
- Page 114:
Table 1-73: Amtrak On-Time Performa
- Page 118 and 119:
Table 2-1: Transportation Fatalitie
- Page 120 and 121:
Table 2-3: Transportation Accidents
- Page 122 and 123:
Table 2-5: Highway-Rail Grade-Cross
- Page 124 and 125:
Table 2-7: Transportation-Related O
- Page 127:
Section BAir
- Page 130 and 131:
Table 2-10: U.S. Commuter Air Carri
- Page 132 and 133:
Table 2-12: U.S. Commuter Air Carri
- Page 134 and 135:
Table 2-14: U.S. General Aviation a
- Page 136 and 137:
Table 2-16b: Prohibited Items Inter
- Page 139:
Section CHighway
- Page 142 and 143:
Table 2-18: Motor Vehicle Fatalitie
- Page 144 and 145:
Table 2-20: Occupant and Nonmotoris
- Page 146 and 147:
Table 2-22: Motorcycle Rider Safety
- Page 148 and 149:
Table 2-24: Bus Occupant Safety Dat
- Page 150 and 151:
Table 2-26: Fatalities by Highest B
- Page 152 and 153:
Table 2-28: Motor Vehicle Fatal Cra
- Page 154 and 155:
Table 2-30: Safety Belt and Motorcy
- Page 157:
Section DTransit
- Page 160 and 161:
Table 2-33: Transit Safety Data by
- Page 162 and 163:
d The number of Unlinked passenger
- Page 164 and 165:
Table 2-36: Transit and Grade-Cross
- Page 166 and 167:
Table 2-38: Reports of Violent Crim
- Page 168:
KEY: N = data do not exist.a The ki
- Page 172 and 173:
Table 2-39: Railroad and Grade-Cros
- Page 174 and 175:
Table 2-41: Train Fatalities, Injur
- Page 176 and 177:
Table 2-43: Railroad System Safety
- Page 178:
Section FWater
- Page 181 and 182:
Table 2-46: Waterborne Transportati
- Page 183 and 184:
Table 2-48: Personal Watercraft Saf
- Page 186:
Section GPipeline
- Page 190:
Chapter 3Transportation andthe Econ
- Page 193 and 194:
Table 3-2: U.S. Gross Domestic Prod
- Page 195 and 196:
Table 3-4: U.S. Gross Domestic Prod
- Page 197 and 198:
Table 3-6: U.S. Gross Domestic Dema
- Page 199 and 200:
Table 3-8: Contributions to Gross D
- Page 201 and 202:
Table 3-10: National Transportation
- Page 204 and 205:
Table 3-11: Sales Price of Transpor
- Page 206 and 207:
Table 3-13: Producer Price Indices
- Page 208 and 209:
Table 3-15: Personal Expenditures b
- Page 210 and 211:
Table 3-17: Average Cost of Owning
- Page 212:
Table 3-19: Average Passenger Fares
- Page 216 and 217:
Table 3-20: Average Passenger Reven
- Page 218 and 219:
Table 3-22: Total Operating Revenue
- Page 220 and 221:
Table 3-24: Employment in Transport
- Page 222 and 223:
Table 3-26: Median Weekly Earnings
- Page 224:
Table 3-28: Labor Productivity Indi
- Page 228 and 229:
Table 3-29: Federal, State, and Loc
- Page 230 and 231:
Table 3-31: Summary of Transportati
- Page 232 and 233:
Table 3-33: Transportation Revenues
- Page 234 and 235:
Table 3-35: Transportation Expendit
- Page 236 and 237:
Table 3-37: Federal Transportation
- Page 239:
Chapter 4Transportation, Energy,and
- Page 242 and 243:
Table 4-2: U.S. Consumption of Ener
- Page 245:
Section BTransportation EnergyConsu
- Page 248 and 249:
Table 4-5: Fuel Consumption by Mode
- Page 250 and 251:
Table 4-7: Domestic Demand for Gaso
- Page 252 and 253:
Table 4-9: Motor Vehicle Fuel Consu
- Page 254 and 255:
Table 4-11: Light Duty Vehicle, Sho
- Page 256 and 257:
Table 4-13: Single-Unit 2-Axle 6-Ti
- Page 258 and 259:
Table 4-15: Bus Fuel Consumption an
- Page 260 and 261:
Table 4-17: Class I Rail Freight Fu
- Page 262 and 263:
Table 4-19: U.S. Government Energy
- Page 265 and 266:
Table 4-20: Energy Intensity of Pas
- Page 267 and 268:
Table 4-22: Energy Intensity of Lig
- Page 269 and 270:
Table 4-24: Energy Intensity of Tra
- Page 271 and 272:
Table 4-26: Energy Intensity of Amt
- Page 273 and 274:
Table 4-28: Annual Wasted Fuel Due
- Page 275 and 276:
Table 4-29: Annual Wasted Fuel Per
- Page 278:
Section DAir Pollution
- Page 281 and 282:
Table 4-31: Federal Exhaust Emissio
- Page 283 and 284:
1968-Table 4-33: Federal Exhaust Em
- Page 285 and 286:
Table 4-35: Federal Exhaust Emissio
- Page 287 and 288:
KEY: CO = carbon monoxide; HC = hyd
- Page 289 and 290:
Table 4-38: Federal Exhaust Emissio
- Page 291 and 292:
KEY: CO = carbon monoxide; g = gram
- Page 293 and 294:
KEY: bhp = brake horsepower; bhph =
- Page 295 and 296:
Table 4-42: Tier 2 Federal Exhaust
- Page 297 and 298:
Table 4-44: Estimated National Aver
- Page 299 and 300:
Table 4-46: Estimated National Emis
- Page 301 and 302:
Table 4-48: Estimated National Emis
- Page 303 and 304:
Table 4-50: Estimated National Emis
- Page 305 and 306:
Monmouth-Ocean, NJ 5 21 4 41 34 31
- Page 307 and 308:
Table 4-52: Areas in Nonattainment
- Page 310:
Section EWater Pollution, Noise,and
- Page 313 and 314:
Table 4-55: Leaking Underground Sto
- Page 315 and 316:
Table 4-57: Number of People Residi
- Page 318:
appendix aMetric ConversionTables
- Page 321 and 322:
Table 1-4M: Kilometers of Public Ro
- Page 323 and 324:
Table 1-35M: U.S. Vehicle-Kilometer
- Page 325 and 326:
Table 1-38M: Average Length of Haul
- Page 327 and 328:
a Includes freight, express, and ma
- Page 329 and 330:
Table 1-56M: U.S. Waterborne Freigh
- Page 331 and 332:
Table 4-3M: Domestic Demand for Ref
- Page 333 and 334:
Table 4-6M: Energy Consumption by M
- Page 335 and 336:
Table 4-8M: Certificated Air Carrie
- Page 337 and 338:
Table 4-11M: Light Duty Vehicle, Sh
- Page 339 and 340:
Table 4-13M: Single-Unit 2-Axle 6-T
- Page 341 and 342:
Table 4-15M: Bus Fuel Consumption a
- Page 343 and 344:
Table 4-17M: Class I Rail Freight F
- Page 345 and 346:
Table 4-19M: U.S. Government Energy
- Page 347 and 348:
Table 4-21M: Energy Intensity of Ce
- Page 349 and 350:
Table 4-23M: Average Fuel Efficienc
- Page 351 and 352:
Table 4-25M: Energy Intensity of Cl
- Page 353 and 354:
Appendix B: GlossaryAIR CARRIER: A
- Page 355 and 356:
Appendix B: GlossaryCOLLISION WITH
- Page 357 and 358:
Appendix B: GlossaryFEDERAL ENERGY
- Page 359 and 360:
Appendix B: GlossaryINJURY (Rail):
- Page 361 and 362:
Appendix B: GlossaryMOTOR BUS (Tran
- Page 363 and 364:
Appendix B: GlossaryPERSONAL BUSINE
- Page 365 and 366:
Appendix B: GlossarySUBCOMPACT CAR:
- Page 367 and 368:
appendix cAcronyms and InitialismsA
- Page 370:
appendix dModal Profiles
- Page 373 and 374:
Air Carrier Profile continuedPerfor
- Page 375 and 376:
Air Carrier Profile continuedPerfor
- Page 377 and 378:
Highway ProfileFINANCIAL 1960 1970
- Page 379 and 380:
General Aviation ProfileINVENTORY 1
- Page 381 and 382:
Motorcycle f f f f 50 50 50 50 50 5
- Page 383 and 384:
KEY: R = revised; U = data are unav
- Page 385 and 386:
Transit ProfileFINANCIAL 1960 1970
- Page 387 and 388:
161960-2006: Fatalities and Injured
- Page 389 and 390:
SAFETY d,9Number of fatalities, rai
- Page 391 and 392:
SAFETYFatalities in waterborne tran
- Page 393 and 394:
Natural Gas Pipeline ProfileFINANCI
- Page 395:
appendix eSource andAccuracy Statem
- Page 398 and 399:
agencies receiving funds through th
- Page 400 and 401:
solicitations of all federally regu
- Page 402 and 403:
Passenger Car, Truck, Bus, and Recr
- Page 404 and 405:
Highway, Total (registered vehicles
- Page 406 and 407:
after 1996. Some jurisdictions fail
- Page 408 and 409:
adherence to federal guidelines reg
- Page 410 and 411:
year. Also, expansion factors are u
- Page 412 and 413:
PassengerAir CarrierThe U.S. Depart
- Page 414 and 415:
The data are from Waterborne Commer
- Page 416 and 417:
The Transborder Surface Freight Dat
- Page 418 and 419:
A second data source for air-carrie
- Page 420 and 421:
Appendix EData Source and Accuracy
- Page 422 and 423:
when data are entered, they are che
- Page 424 and 425:
vehicles, and 15 were deleted becau
- Page 426 and 427:
TABLE 2-4. Distribution of Transpor
- Page 428 and 429:
BEA personal consumption expenditur
- Page 430 and 431:
Transportation-related government p
- Page 432 and 433:
information on their data collectio
- Page 434 and 435:
AccuracyAs in all surveys, the accu
- Page 436 and 437:
The American Public Transit Associa
- Page 438 and 439:
Government EmploymentThe Office of
- Page 440 and 441:
specifications or equations, should
- Page 442 and 443:
As mentioned above, the Highway Rev
- Page 444 and 445:
Highway ExpendituresFederal Highway
- Page 446 and 447:
consistency between the different m
- Page 448 and 449:
Appendix EData Source and Accuracy
- Page 450 and 451:
when data are entered, they are che
- Page 452 and 453:
vehicles, and 15 were deleted becau
- Page 454 and 455:
TABLE 2-4. Distribution of Transpor
- Page 456 and 457:
agencies receiving funds through th
- Page 458 and 459:
solicitations of all federally regu
- Page 460 and 461:
Passenger Car, Truck, Bus, and Recr
- Page 462 and 463:
Highway, Total (registered vehicles
- Page 464 and 465:
after 1996. Some jurisdictions fail
- Page 466 and 467:
adherence to federal guidelines reg
- Page 468 and 469:
year. Also, expansion factors are u
- Page 470 and 471:
PassengerAir CarrierThe U.S. Depart
- Page 472 and 473:
The data are from Waterborne Commer
- Page 474 and 475:
The Transborder Surface Freight Dat
- Page 476 and 477:
A second data source for air-carrie
- Page 478 and 479:
Appendix EData Source and Accuracy
- Page 480 and 481:
If transportation had been reviewed
- Page 482 and 483:
Alternative FuelsIn addition to oxy
- Page 484 and 485:
RailThe data are from Railroad Fact
- Page 486 and 487:
multiplied by the average peak peri
- Page 488 and 489:
In general, lead emissions are esti
- Page 490 and 491:
The number of the people exposed to
- Page 492 and 493:
Appendix EData Source and Accuracy
- Page 494 and 495:
If transportation had been reviewed
- Page 496 and 497:
Alternative FuelsIn addition to oxy
- Page 498 and 499:
RailThe data are from Railroad Fact
- Page 500 and 501:
multiplied by the average peak peri
- Page 502 and 503:
In general, lead emissions are esti
- Page 504 and 505:
The number of the people exposed to