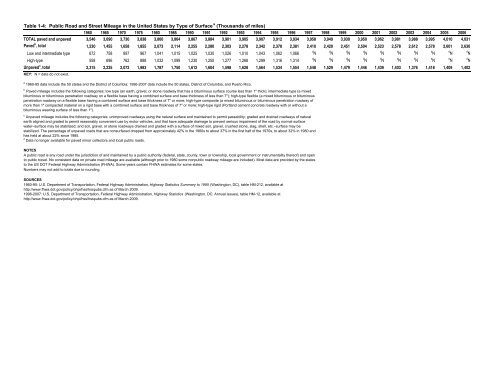
Table 1-4: Public Road and Street Mileage in the United States by Type <strong>of</strong> Surface a (Thousands <strong>of</strong> miles)1960 1965 1970 1975 1980 1985 1990 1991 1992 1993 1994 1995 1996 1997 1998 1999 2000 2001 2002 2003 2004 2005 2006TOTAL paved and unpaved 3,546 3,690 3,730 3,838 3,860 3,864 3,867 3,884 3,901 3,905 3,907 3,912 3,934 3,958 3,949 3,930 3,950 3,962 3,981 3,988 3,995 4,010 4,031Paved b , total 1,230 1,455 1,658 1,855 2,073 2,114 2,255 2,280 2,303 2,278 2,342 2,378 2,381 2,410 2,420 2,451 2,504 2,523 2,578 2,612 2,578 2,601 2,630Low and intermediate type 672 758 897 967 1,041 1,015 1,025 1,030 1,026 1,010 1,043 1,062 1,066d Nd Nd Nd Nd Nd Nd Nd Nd Nd NHigh-type 558 696 762 888 1,032 1,099 1,230 1,250 1,277 1,268 1,299 1,316 1,314d Nd Nd Nd Nd Nd Nd Nd Nd Nd NUnpaved c , total 2,315 2,235 2,072 1,983 1,787 1,750 1,612 1,604 1,598 1,628 1,564 1,534 1,554 1,548 1,529 1,479 1,446 1,439 1,403 1,376 1,418 1,409 1,402KEY: N = data do not exist.a 1960-95 data include the 50 states and the District <strong>of</strong> Columbia; 1996-2007 data include the 50 states, District <strong>of</strong> Columbia, and Puerto Rico.bPaved mileage includes the following categories: low type (an earth, gravel, or stone roadway that has a bituminous surface course less than 1" thick); intermediate type (a mixedbituminous or bituminous penetration roadway on a flexible base having a combined surface and base thickness <strong>of</strong> less than 7"); high-type flexible (a mixed bituminous or bituminouspenetration roadway on a flexible base having a combined surface and base thickness <strong>of</strong> 7" or more; high-type composite (a mixed bituminous or bituminous penetration roadway <strong>of</strong>more than 1" compacted material on a rigid base with a combined surface and base thickness <strong>of</strong> 7" or more; high-type rigid (Portland cement concrete roadway with or without abituminous wearing surface <strong>of</strong> less than 1").c Unpaved mileage includes the following categories: unimproved roadways using the natural surface and maintained to permit passability; graded and drained roadways <strong>of</strong> naturalearth aligned and graded to permit reasonably convenient use by motor vehicles, and that have adequate drainage to prevent serious impairment <strong>of</strong> the road by normal surfacewater–surface may be stabilized; and soil, gravel, or stone roadways drained and graded with a surface <strong>of</strong> mixed soil, gravel, crushed stone, slag, shell, etc.–surface may bestabilized. The percentage <strong>of</strong> unpaved roads that are nonsurfaced dropped from approximately 42% in the 1960s to about 37% in the first half <strong>of</strong> the 1970s, to about 32% in 1980 andhas held at about 22% since 1985.d Data no longer available for paved minor collectors and local public roads.NOTESA public road is any road under the jurisdiction <strong>of</strong> and maintained by a public authority (federal, state, county, town or township, local government or instrumentality there<strong>of</strong>) and opento public travel. No consistent data on private road mileage are available (although prior to 1980 some nonpublic roadway mileage are included). Most data are provided by the statesto the <strong>US</strong> DOT Federal Highway Administration (FHWA). Some years contain FHWA estimates for some states.Numbers may not add to totals due to rounding.SOURCES1960-95: U.S. <strong>Department</strong> <strong>of</strong> <strong>Transportation</strong>, Federal Highway Administration, Highway Statistics Summary to 1995 (Washington, DC), table HM-212, available athttp://www.fhwa.dot.gov/policy/ohpi/hss/hsspubs.cfm as <strong>of</strong> March 2009.1996-2007: U.S. <strong>Department</strong> <strong>of</strong> <strong>Transportation</strong>, Federal Highway Administration, Highway Statistics (Washington, DC: Annual issues), table HM-12, available athttp://www.fhwa.dot.gov/policy/ohpi/hss/hsspubs.cfm as <strong>of</strong> March 2009.
Table 1-5: U.S. Public Road and Street Mileage by Functional System a1990 1991 1992 1993 1994 1995 1996 1997 (R) 1998 1999 2000 2001 2002 2003 2004 2005 2006 2007 2008TOTAL urban and rural mileage 3,866,926 3,883,920 3,901,081 3,905,211 3,906,595 3,912,226 3,919,652 3,945,872 3,906,292 3,917,243 3,936,222 3,948,335 3,966,486 3,974,107 3,981,512 3,995,635 4,016,741 4,032,126 4,042,778Urban mileage, total 744,644 749,862 785,066 805,877 813,785 819,706 826,765 836,740 841,643 846,085 852,243 877,004 894,725 940,969 981,276 1,009,839 1,029,366 1,044,368 1,065,556Principal arterials, Interstates 11,527 11,602 12,516 12,877 13,126 13,164 13,217 13,247 13,276 13,343 13,379 13,411 13,491 14,460 15,129 15,703 16,044 16,312 16,555Principal arterials, other freeways, and expressways 7,668 7,709 8,491 8,841 8,994 8,970 9,027 9,063 9,163 9,132 9,140 9,121 9,323 9,870 10,246 10,560 10,748 10,913 11,335Principal arterials, other 51,968 52,515 51,900 52,708 53,110 52,796 52,983 53,223 53,132 53,199 53,314 53,056 53,439 56,870 59,695 61,803 62,830 63,282 64,557Minor arterials 74,659 74,795 80,815 86,821 87,857 88,510 89,020 89,185 89,496 89,432 89,789 89,962 90,411 93,888 97,433 101,673 102,975 104,033 106,172Collectors 78,254 77,102 82,784 84,854 86,089 87,331 87,790 88,049 88,071 88,005 88,200 88,713 89,247 97,114 102,150 106,109 108,833 109,555 113,848Local 520,568 526,139 548,560 559,776 564,609 568,935 574,728 583,973 588,505 592,974 598,421 622,741 638,814 668,767 696,623 713,991 727,936 740,273 753,089Rural mileage, total 3,122,282 3,134,058 3,116,015 3,099,334 3,092,810 3,092,520 3,092,887 3,109,132 3,064,649 3,071,158 3,083,979 3,071,331 3,071,761 3,033,138 3,000,236 2,985,796 2,987,375 2,987,758 2,977,222Principal arterials, Interstates 33,547 33,677 32,951 32,631 32,457 32,580 32,820 32,817 32,808 32,974 33,048 33,061 32,992 32,048 31,443 30,905 30,586 30,360 30,196Principal arterials, other 83,802 86,747 94,947 96,770 97,175 97,948 98,131 98,257 98,858 98,838 98,919 99,185 98,853 97,038 95,946 95,156 94,937 94,766 94,949Minor arterials 144,774 141,795 137,685 137,577 138,120 137,151 137,359 137,497 137,308 137,462 137,575 137,587 137,568 135,596 135,449 135,408 135,386 135,296 135,024Major collectors 436,352 436,746 434,072 432,222 431,115 431,712 432,117 432,714 432,408 432,934 433,121 433,284 430,946 424,288 420,046 419,999 419,117 419,437 418,229Minor collectors 293,922 293,511 284,504 282,182 282,011 274,081 273,198 272,362 272,140 271,676 271,803 271,377 270,700 267,524 267,842 264,387 262,841 262,899 262,607Local 2,129,885 2,141,582 2,131,856 2,117,952 2,111,932 2,119,048 2,119,262 2,135,485 2,091,127 2,097,274 2,109,513 2,096,837 2,100,702 2,076,644 2,049,510 2,039,941 2,044,508 2,045,000 2,036,217KEY: R = revised.aIncludes the 50 states and the District <strong>of</strong> Columbia. When states did not submit reports, data were estimated by the U.S. <strong>Department</strong> <strong>of</strong> <strong>Transportation</strong>, Federal HighwayAdministration.NOTESA public road is any road under the ownership <strong>of</strong> and maintained by a public authority (federal, state, county, town or township, local government or instrumentality there<strong>of</strong>) andopen to public travel. No consistent data on private road mileage are available. For more detailed information, including breakouts <strong>of</strong> mileage by ownership and type <strong>of</strong> surface,see the source document.Beginning in 2005, approximately 4,085 miles <strong>of</strong> federal agency and local government owned roads are excluded.Other Principal arterials rural mileage for 2009 includes 888 miles <strong>of</strong> other freeways and expressways.SOURCE1990-2010: U.S. <strong>Department</strong> <strong>of</strong> <strong>Transportation</strong>, Federal Highway Administration, Highway Statistics (Washington, DC: Annual Issues), table HM-220, available athttp://www.fhwa.dot.gov/policy/ohpi/hss/hsspubs.cfm as <strong>of</strong> Spet. 25, 2012.
- Page 1: NationalTransportationStatistics
- Page 4 and 5: AcknowledgmentsU.S. Department of T
- Page 7 and 8: Table of ContentsINTRODUCTIONTable
- Page 9 and 10: 1-56 U.S. Waterborne Freight (Updat
- Page 11 and 12: SECTION E. RAILROAD2-39 Railroad an
- Page 13 and 14: 3-35 Transportation Expenditures by
- Page 15 and 16: 4-51 Air Pollution Trends in Select
- Page 18: IntroductionCompiled and published
- Page 21: SOURCESU.S. resident population, ag
- Page 25 and 26: Table 1-1: System Mileage Within th
- Page 27: Table 1-3: Number of U.S. Airports
- Page 31 and 32: Table 1-7: Number of Stations Serve
- Page 33 and 34: Table 1-9: ADA-Accessible Rail Tran
- Page 36: Section BVehicle, Aircraft, andVess
- Page 39 and 40: Table 1-12: U.S. Sales or Deliverie
- Page 41 and 42: Table 1-14: U.S. Automobile and Tru
- Page 43 and 44: Table 1-16: Retail a New Passenger
- Page 45 and 46: Table 1-18: Retail Sales of New Car
- Page 47 and 48: Table 1-20: Period Sales, Market Sh
- Page 49 and 50: Table 1-22: Number of Trucks by Wei
- Page 51 and 52: Taiwan U U U 116 132 124 101 113 11
- Page 53: Section CCondition
- Page 56 and 57: Table 1-26: Average Age of Automobi
- Page 58 and 59: Table 1-28: Condition of U.S. Highw
- Page 60 and 61: Table 1-30: Condition of Urban Bus
- Page 62 and 63: Table 1-32: Class I Railroad Locomo
- Page 64 and 65: Table 1-34: U.S. Flag Vessels by Ty
- Page 66 and 67: Table 1-36: Roadway Vehicle-Miles T
- Page 68 and 69: Table 1-38: Average Length of Haul,
- Page 70 and 71: Table 1-40: U.S. Passenger-Miles (M
- Page 72 and 73: Table 1-42: Long-Distance Travel in
- Page 74 and 75: Table 1-43: Long-Distance Travel in
- Page 76 and 77: Table 1-45: Air Passenger Travel Ar
- Page 79:
Section DTravel and GoodsMovement
- Page 82 and 83:
Table 1-48: U.S.-Mexican Border Lan
- Page 84 and 85:
Table 1-50: U.S. Ton-Miles of Freig
- Page 86 and 87:
Table 1-52: U.S.-Canadian Border La
- Page 88 and 89:
Table 1-54: U.S.-Mexican Border Lan
- Page 90 and 91:
Table 1-56: U.S. Waterborne Freight
- Page 92 and 93:
Table 1-58: Freight Activity in the
- Page 94 and 95:
Table 1-60: Value of U.S. Land Expo
- Page 96 and 97:
Table 1-61M: Crude Oil and Petroleu
- Page 98:
Table 1-63: U.S. Hazardous Material
- Page 102 and 103:
Table 1-64: Passengers Boarded and
- Page 104 and 105:
Table 1-66: Flight Operations Arriv
- Page 106 and 107:
Table 1-68: Major U.S. Air Carrier
- Page 108 and 109:
Table 1-69: Annual Person-Hours of
- Page 110 and 111:
Table 1-70: Travel Time IndexShort-
- Page 112 and 113:
Table 1-71: Annual Roadway Congesti
- Page 114:
Table 1-73: Amtrak On-Time Performa
- Page 118 and 119:
Table 2-1: Transportation Fatalitie
- Page 120 and 121:
Table 2-3: Transportation Accidents
- Page 122 and 123:
Table 2-5: Highway-Rail Grade-Cross
- Page 124 and 125:
Table 2-7: Transportation-Related O
- Page 127:
Section BAir
- Page 130 and 131:
Table 2-10: U.S. Commuter Air Carri
- Page 132 and 133:
Table 2-12: U.S. Commuter Air Carri
- Page 134 and 135:
Table 2-14: U.S. General Aviation a
- Page 136 and 137:
Table 2-16b: Prohibited Items Inter
- Page 139:
Section CHighway
- Page 142 and 143:
Table 2-18: Motor Vehicle Fatalitie
- Page 144 and 145:
Table 2-20: Occupant and Nonmotoris
- Page 146 and 147:
Table 2-22: Motorcycle Rider Safety
- Page 148 and 149:
Table 2-24: Bus Occupant Safety Dat
- Page 150 and 151:
Table 2-26: Fatalities by Highest B
- Page 152 and 153:
Table 2-28: Motor Vehicle Fatal Cra
- Page 154 and 155:
Table 2-30: Safety Belt and Motorcy
- Page 157:
Section DTransit
- Page 160 and 161:
Table 2-33: Transit Safety Data by
- Page 162 and 163:
d The number of Unlinked passenger
- Page 164 and 165:
Table 2-36: Transit and Grade-Cross
- Page 166 and 167:
Table 2-38: Reports of Violent Crim
- Page 168:
KEY: N = data do not exist.a The ki
- Page 172 and 173:
Table 2-39: Railroad and Grade-Cros
- Page 174 and 175:
Table 2-41: Train Fatalities, Injur
- Page 176 and 177:
Table 2-43: Railroad System Safety
- Page 178:
Section FWater
- Page 181 and 182:
Table 2-46: Waterborne Transportati
- Page 183 and 184:
Table 2-48: Personal Watercraft Saf
- Page 186:
Section GPipeline
- Page 190:
Chapter 3Transportation andthe Econ
- Page 193 and 194:
Table 3-2: U.S. Gross Domestic Prod
- Page 195 and 196:
Table 3-4: U.S. Gross Domestic Prod
- Page 197 and 198:
Table 3-6: U.S. Gross Domestic Dema
- Page 199 and 200:
Table 3-8: Contributions to Gross D
- Page 201 and 202:
Table 3-10: National Transportation
- Page 204 and 205:
Table 3-11: Sales Price of Transpor
- Page 206 and 207:
Table 3-13: Producer Price Indices
- Page 208 and 209:
Table 3-15: Personal Expenditures b
- Page 210 and 211:
Table 3-17: Average Cost of Owning
- Page 212:
Table 3-19: Average Passenger Fares
- Page 216 and 217:
Table 3-20: Average Passenger Reven
- Page 218 and 219:
Table 3-22: Total Operating Revenue
- Page 220 and 221:
Table 3-24: Employment in Transport
- Page 222 and 223:
Table 3-26: Median Weekly Earnings
- Page 224:
Table 3-28: Labor Productivity Indi
- Page 228 and 229:
Table 3-29: Federal, State, and Loc
- Page 230 and 231:
Table 3-31: Summary of Transportati
- Page 232 and 233:
Table 3-33: Transportation Revenues
- Page 234 and 235:
Table 3-35: Transportation Expendit
- Page 236 and 237:
Table 3-37: Federal Transportation
- Page 239:
Chapter 4Transportation, Energy,and
- Page 242 and 243:
Table 4-2: U.S. Consumption of Ener
- Page 245:
Section BTransportation EnergyConsu
- Page 248 and 249:
Table 4-5: Fuel Consumption by Mode
- Page 250 and 251:
Table 4-7: Domestic Demand for Gaso
- Page 252 and 253:
Table 4-9: Motor Vehicle Fuel Consu
- Page 254 and 255:
Table 4-11: Light Duty Vehicle, Sho
- Page 256 and 257:
Table 4-13: Single-Unit 2-Axle 6-Ti
- Page 258 and 259:
Table 4-15: Bus Fuel Consumption an
- Page 260 and 261:
Table 4-17: Class I Rail Freight Fu
- Page 262 and 263:
Table 4-19: U.S. Government Energy
- Page 265 and 266:
Table 4-20: Energy Intensity of Pas
- Page 267 and 268:
Table 4-22: Energy Intensity of Lig
- Page 269 and 270:
Table 4-24: Energy Intensity of Tra
- Page 271 and 272:
Table 4-26: Energy Intensity of Amt
- Page 273 and 274:
Table 4-28: Annual Wasted Fuel Due
- Page 275 and 276:
Table 4-29: Annual Wasted Fuel Per
- Page 278:
Section DAir Pollution
- Page 281 and 282:
Table 4-31: Federal Exhaust Emissio
- Page 283 and 284:
1968-Table 4-33: Federal Exhaust Em
- Page 285 and 286:
Table 4-35: Federal Exhaust Emissio
- Page 287 and 288:
KEY: CO = carbon monoxide; HC = hyd
- Page 289 and 290:
Table 4-38: Federal Exhaust Emissio
- Page 291 and 292:
KEY: CO = carbon monoxide; g = gram
- Page 293 and 294:
KEY: bhp = brake horsepower; bhph =
- Page 295 and 296:
Table 4-42: Tier 2 Federal Exhaust
- Page 297 and 298:
Table 4-44: Estimated National Aver
- Page 299 and 300:
Table 4-46: Estimated National Emis
- Page 301 and 302:
Table 4-48: Estimated National Emis
- Page 303 and 304:
Table 4-50: Estimated National Emis
- Page 305 and 306:
Monmouth-Ocean, NJ 5 21 4 41 34 31
- Page 307 and 308:
Table 4-52: Areas in Nonattainment
- Page 310:
Section EWater Pollution, Noise,and
- Page 313 and 314:
Table 4-55: Leaking Underground Sto
- Page 315 and 316:
Table 4-57: Number of People Residi
- Page 318:
appendix aMetric ConversionTables
- Page 321 and 322:
Table 1-4M: Kilometers of Public Ro
- Page 323 and 324:
Table 1-35M: U.S. Vehicle-Kilometer
- Page 325 and 326:
Table 1-38M: Average Length of Haul
- Page 327 and 328:
a Includes freight, express, and ma
- Page 329 and 330:
Table 1-56M: U.S. Waterborne Freigh
- Page 331 and 332:
Table 4-3M: Domestic Demand for Ref
- Page 333 and 334:
Table 4-6M: Energy Consumption by M
- Page 335 and 336:
Table 4-8M: Certificated Air Carrie
- Page 337 and 338:
Table 4-11M: Light Duty Vehicle, Sh
- Page 339 and 340:
Table 4-13M: Single-Unit 2-Axle 6-T
- Page 341 and 342:
Table 4-15M: Bus Fuel Consumption a
- Page 343 and 344:
Table 4-17M: Class I Rail Freight F
- Page 345 and 346:
Table 4-19M: U.S. Government Energy
- Page 347 and 348:
Table 4-21M: Energy Intensity of Ce
- Page 349 and 350:
Table 4-23M: Average Fuel Efficienc
- Page 351 and 352:
Table 4-25M: Energy Intensity of Cl
- Page 353 and 354:
Appendix B: GlossaryAIR CARRIER: A
- Page 355 and 356:
Appendix B: GlossaryCOLLISION WITH
- Page 357 and 358:
Appendix B: GlossaryFEDERAL ENERGY
- Page 359 and 360:
Appendix B: GlossaryINJURY (Rail):
- Page 361 and 362:
Appendix B: GlossaryMOTOR BUS (Tran
- Page 363 and 364:
Appendix B: GlossaryPERSONAL BUSINE
- Page 365 and 366:
Appendix B: GlossarySUBCOMPACT CAR:
- Page 367 and 368:
appendix cAcronyms and InitialismsA
- Page 370:
appendix dModal Profiles
- Page 373 and 374:
Air Carrier Profile continuedPerfor
- Page 375 and 376:
Air Carrier Profile continuedPerfor
- Page 377 and 378:
Highway ProfileFINANCIAL 1960 1970
- Page 379 and 380:
General Aviation ProfileINVENTORY 1
- Page 381 and 382:
Motorcycle f f f f 50 50 50 50 50 5
- Page 383 and 384:
KEY: R = revised; U = data are unav
- Page 385 and 386:
Transit ProfileFINANCIAL 1960 1970
- Page 387 and 388:
161960-2006: Fatalities and Injured
- Page 389 and 390:
SAFETY d,9Number of fatalities, rai
- Page 391 and 392:
SAFETYFatalities in waterborne tran
- Page 393 and 394:
Natural Gas Pipeline ProfileFINANCI
- Page 395:
appendix eSource andAccuracy Statem
- Page 398 and 399:
agencies receiving funds through th
- Page 400 and 401:
solicitations of all federally regu
- Page 402 and 403:
Passenger Car, Truck, Bus, and Recr
- Page 404 and 405:
Highway, Total (registered vehicles
- Page 406 and 407:
after 1996. Some jurisdictions fail
- Page 408 and 409:
adherence to federal guidelines reg
- Page 410 and 411:
year. Also, expansion factors are u
- Page 412 and 413:
PassengerAir CarrierThe U.S. Depart
- Page 414 and 415:
The data are from Waterborne Commer
- Page 416 and 417:
The Transborder Surface Freight Dat
- Page 418 and 419:
A second data source for air-carrie
- Page 420 and 421:
Appendix EData Source and Accuracy
- Page 422 and 423:
when data are entered, they are che
- Page 424 and 425:
vehicles, and 15 were deleted becau
- Page 426 and 427:
TABLE 2-4. Distribution of Transpor
- Page 428 and 429:
BEA personal consumption expenditur
- Page 430 and 431:
Transportation-related government p
- Page 432 and 433:
information on their data collectio
- Page 434 and 435:
AccuracyAs in all surveys, the accu
- Page 436 and 437:
The American Public Transit Associa
- Page 438 and 439:
Government EmploymentThe Office of
- Page 440 and 441:
specifications or equations, should
- Page 442 and 443:
As mentioned above, the Highway Rev
- Page 444 and 445:
Highway ExpendituresFederal Highway
- Page 446 and 447:
consistency between the different m
- Page 448 and 449:
Appendix EData Source and Accuracy
- Page 450 and 451:
when data are entered, they are che
- Page 452 and 453:
vehicles, and 15 were deleted becau
- Page 454 and 455:
TABLE 2-4. Distribution of Transpor
- Page 456 and 457:
agencies receiving funds through th
- Page 458 and 459:
solicitations of all federally regu
- Page 460 and 461:
Passenger Car, Truck, Bus, and Recr
- Page 462 and 463:
Highway, Total (registered vehicles
- Page 464 and 465:
after 1996. Some jurisdictions fail
- Page 466 and 467:
adherence to federal guidelines reg
- Page 468 and 469:
year. Also, expansion factors are u
- Page 470 and 471:
PassengerAir CarrierThe U.S. Depart
- Page 472 and 473:
The data are from Waterborne Commer
- Page 474 and 475:
The Transborder Surface Freight Dat
- Page 476 and 477:
A second data source for air-carrie
- Page 478 and 479:
Appendix EData Source and Accuracy
- Page 480 and 481:
If transportation had been reviewed
- Page 482 and 483:
Alternative FuelsIn addition to oxy
- Page 484 and 485:
RailThe data are from Railroad Fact
- Page 486 and 487:
multiplied by the average peak peri
- Page 488 and 489:
In general, lead emissions are esti
- Page 490 and 491:
The number of the people exposed to
- Page 492 and 493:
Appendix EData Source and Accuracy
- Page 494 and 495:
If transportation had been reviewed
- Page 496 and 497:
Alternative FuelsIn addition to oxy
- Page 498 and 499:
RailThe data are from Railroad Fact
- Page 500 and 501:
multiplied by the average peak peri
- Page 502 and 503:
In general, lead emissions are esti
- Page 504 and 505:
The number of the people exposed to