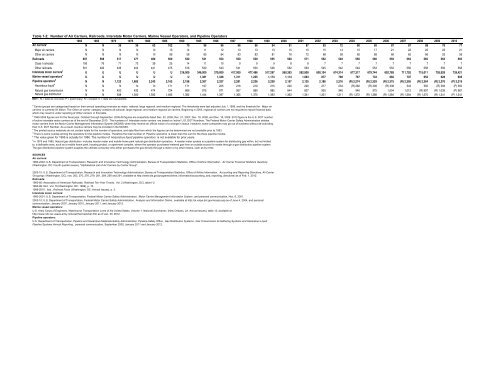
Table 1-2: Number <strong>of</strong> Air Carriers, Railroads, Interstate Motor Carriers, Marine Vessel Operators, and Pipeline Operators1960 1965 1970 1975 1980 1985 1990 1995 1996 1997 1998 1999 2000 2001 2002 2003 2004 2005 2006 2007 2008 2009 2010Air carriers a N N 39 36 63 102 70 96 96 96 96 94 91 87 83 72 80 85 87 87 88 76 77Major air carriers N N N N N 13 14 11 12 13 13 13 15 15 15 14 15 17 21 22 22 23 21Other air carriers N N N N N 89 56 85 84 83 83 81 76 72 68 58 65 68 66 65 66 53 56Railroads 607 568 517 477 480 500 530 541 553 550 559 555 560 571 552 549 556 560 559 563 565 563 565Class I railroads 106 76 71 73 39 25 14 11 10 9 9 9 8 8 7 7 7 7 7 7 7 7 7Other railroads 501 492 446 404 441 475 516 530 543 541 550 546 552 563 545 542 549 553 552 556 558 556 558Interstate motor carriers b U U U U U U 216,000 346,000 379,000 417,000 477,486 517,297 560,393 592,909 600,104 674,314 677,317 679,744 692,789 711,792 715,011 726,928 739,421Marine vessel operators c U U U U U U U 1,381 1,348 1,311 1,235 1,174 1,114 1,063 877 798 767 733 682 707 652 628 603Pipeline operators d N N 1,123 1,682 2,243 2,163 2,198 2,367 2,327 2,281 2,236 2,238 2,157 2,135 2,186 2,216 (R) 2,274 (R) 2,329 (R) 2,375 (R) 2,395 (R) 2,364 (R) 2,376 (P) 2,219Hazardous liquid e N N N N N 171 171 197 205 216 219 215 220 220 217 234 (R) 282 (R) 308 (R) 338 343 350 (R) 356 (P) 350Natural gas transmission N N 420 432 474 724 866 975 971 957 889 885 844 837 920 948 946 975 1,004 1,012 (R) 997 (R) 1,039 (P) 981Natural gas distribution f N N 938 1,500 1,932 1,485 1,382 1,444 1,397 1,365 1,375 1,393 1,363 1,341 1,331 1,311 (R) 1,372 (R) 1,388 (R) 1,384 (R) 1,394 (R) 1,370 (R) 1,341 (P) 1,241KEY: N = data do not exist; P = preliminary; R = revised; U = data are unavailable.aCarrier groups are categorized based on their annual operating revenues as major, national, large regional, and medium regional. The thresholds were last adjusted July 1, 1999, and the threshold for Major aircarriers is currently $1 billion. The Other air carrier category contains all national, large regional, and medium regional air carriers. Beginning in 2003, regional air carriers are not required to report financial datawhich may result in under reporting <strong>of</strong> Other carriers in this table.b1960-2005 figures are for the fiscal year, October through September. 2006-09 figures are snapshots dated Dec. 22, 2006; Dec. 21, 2007; Dec. 19, 2008, and Dec. 18, 2009. 2010 figure is the U.S. DOT number<strong>of</strong> active interstate motor carriers as <strong>of</strong> the end <strong>of</strong> December 2010. The numbers <strong>of</strong> Interstate motor carriers are based on 'active' U.S. DOT Numbers. The Federal Motor Carrier Safety Administration deletesmotor carriers from the Motor Carrier Management Information System (MCMIS) when they receive an <strong>of</strong>ficial notice <strong>of</strong> a change in status. However, some companies may go out <strong>of</strong> business without de-activatingtheir U.S. DOT Number. As a result, inactive carriers may be included in the MCMIS.cThe printed source materials do not contain totals for the number <strong>of</strong> operators, and data files from which the figures can be determined are not available prior to 1993.d There is some overlap among the operators for the pipeline modes. Therefore the total number <strong>of</strong> Pipeline operators is lower than the sum for the three pipeline modes.e The value given for 1985 is actually for 1986. The number <strong>of</strong> Hazardous liquid pipeline operators is not available for prior years.f In 1975 and 1980, Natural gas distribution includes master meter and mobile home park natural gas distribution operators. A master meter system is a pipeline system for distributing gas within, but not limitedto, a definable area, such as a mobile home park, housing project, or apartment complex, where the operator purchases metered gas from an outside source for resale through a gas distribution pipeline system.The gas distribution pipeline system supplies the ultimate consumer who either purchases the gas directly through a meter or by other means, such as by rents.SOURCESAir carriers:1960-2002: U.S. <strong>Department</strong> <strong>of</strong> <strong>Transportation</strong>, Research and Innovative Technology Administration, Bureau <strong>of</strong> <strong>Transportation</strong> Statistics, Office <strong>of</strong> Airline Information, Air Carrier Financial Statistics Quarterly(Washington, DC: Fourth quarter issues), "Alphabetical List <strong>of</strong> Air Carriers by Carrier Group".2003-10: U.S. <strong>Department</strong> <strong>of</strong> <strong>Transportation</strong>, Research and Innovative Technology Administration, Bureau <strong>of</strong> <strong>Transportation</strong> Statistics, Office <strong>of</strong> Airline Information, Accounting and Reporting Directives, All CarrierGroupings (Washington, DC), nos. 263, 270, 276, 279, 281, 284, 290 and 291, available at http://www.bts.gov/programs/airline_information/accounting_and_reporting_directives/ as <strong>of</strong> Feb. 1, 2012.Railroads:1960-85: Association <strong>of</strong> American Railroads, Railroad Ten-Year Trends , Vol. 2 (Washington, DC), table I-2.1990-98: Ibid., Vol. 16 (Washington, DC: 1999), p. 10.1999-2010: Ibid., Railroad Facts (Washington, DC: Annual Issues), p. 3.Interstate motor carriers:1990-2001: U.S. <strong>Department</strong> <strong>of</strong> <strong>Transportation</strong>, Federal Motor Carrier Safety Administration, Motor Carrier Management Information System , and personal communication, Nov. 6, 2001.2002-10: U.S. <strong>Department</strong> <strong>of</strong> <strong>Transportation</strong>, Federal Motor Carrier Safety Administration, Analysis and Information Online , available at http://ai.volpe.dot.gov/mcspa.asp as <strong>of</strong> June 4, 2004, and personalcommunication, January 2007, January 2010, January 2011, and January 2012.Marine vessel operators:U.S. Army Corps <strong>of</strong> Engineers, Waterborne <strong>Transportation</strong> Lines <strong>of</strong> the United States, Volume 1, National Summaries (New Orleans, LA: Annual Issues), table 13, available athttp://www.ndc.iwr.usace.army.mil/veslchar/veslchar.htm as <strong>of</strong> Jan. 30, 2012.Pipeline operators:U.S. <strong>Department</strong> <strong>of</strong> <strong>Transportation</strong>, Pipeline and Hazardous Materials Safety Administration, Pipeline Safety Office, Gas Distribution Systems , Gas Transmission & Gathering Systems and Hazardous LiquidPipeline Systems Annual Reporting , personal communication, September 2009, January 2011 and January 2012.
Table 1-3: Number <strong>of</strong> U.S. Airports a1980 1985 1990 1991 1992 1993 1994 1995 1996 1997 1998 1999 2000 2001 2002 2003 2004 2005 2006 2007 2008 2009 2010 2011TOTAL airports b 15,161 16,319 17,490 17,581 17,846 18,317 18,343 18,224 18,292 18,345 18,770 19,098 19,281 19,356 19,572 19,581 19,820 19,854 19,983 20,341 19,930 19,750 19,802 19,782Public use, total 4,814 5,858 5,589 5,551 5,545 5,538 5,474 5,415 5,389 5,357 5,352 5,324 5,317 5,294 5,286 5,286 5,288 5,270 5,233 5,221 5,202 5,178 5,175 5,172Lighted runways, percent 66.2 68.1 71.4 71.9 72.3 72.8 73.5 74.3 74.5 74.6 74.8 76.1 75.9 76.2 76.1 76.2 76.3 76.8 77.2 U U U U UPaved runways, percent 72.3 66.7 70.7 71.5 71.6 72.2 72.9 73.3 73.7 74.0 74.2 74.2 74.3 74.6 74.5 74.5 74.5 74.8 75.3 U U U U UPrivate use, total 10,347 10,461 11,901 12,030 12,301 12,779 12,869 12,809 12,903 12,988 13,418 13,774 13,964 14,062 14,286 14,295 14,532 14,584 14,757 14,839 14,451 14,298 14,353 14,339Lighted runways, percent 15.2 9.1 7.0 6.8 6.6 6.3 6.2 6.4 6.4 6.4 6.3 6.7 7.2 8.0 8.3 8.6 9.0 9.2 9.5 U U U U UPaved runways, percent 13.3 17.4 31.5 32.0 32.2 32.7 33.0 33.0 32.9 33.0 33.2 31.8 32.0 32.4 32.4 32.7 32.8 33.2 33.3 U U U U UMilitary U U U U U U U U U U U U U U U U U U U 281 277 274 274 271TOTAL airports 15,161 16,319 17,490 17,581 17,846 18,317 18,343 18,224 18,292 18,345 18,770 19,098 19,281 19,356 19,572 19,581 19,820 19,854 19,983 20,341 19,930 19,750 19,802 19,782Certificated c , total 730 700 680 669 664 670 672 667 671 660 660 655 651 635 633 628 599 575 604 565 560 559 551 547Civil U U U U U U 577 572 577 566 566 565 563 560 558 555 542 U U U U U U UMilitary U U U U U U 95 95 94 94 94 90 88 75 75 73 57 U U U U U U UGeneral aviation, total 14,431 15,619 16,810 16,912 17,182 17,647 17,671 17,557 17,621 17,685 18,110 18,443 18,630 18,721 18,939 18,953 19,221 19,279 19,379 19,776 19,370 19,191 19,251 19,235KEY: U = data are unavailable.aIncludes civil and joint-use civil-military airports, heliports, STOL (short take<strong>of</strong>f and landing) ports, and seaplane bases in the United States and its territories. Sole-use militaryairports are included beginning in 2007.bTotal airports in 2006 does not sum from Public and Private based on the source data.cCertificated airports serve air-carrier operations with aircraft seating more than 9 passengers. As <strong>of</strong> 2005, the Federal Aviation Administration (FAA) no longer certificates militaryairports.SOURCEU.S. <strong>Department</strong> <strong>of</strong> <strong>Transportation</strong>, Federal Aviation Administration, Administrator's Fact Book (Washington, DC), available athttp://www.faa.gov/about/<strong>of</strong>fice_org/headquarters_<strong>of</strong>fices/aba/admin_factbook/ as <strong>of</strong> Aug. 15, 2012.
- Page 1: NationalTransportationStatistics
- Page 4 and 5: AcknowledgmentsU.S. Department of T
- Page 7 and 8: Table of ContentsINTRODUCTIONTable
- Page 9 and 10: 1-56 U.S. Waterborne Freight (Updat
- Page 11 and 12: SECTION E. RAILROAD2-39 Railroad an
- Page 13 and 14: 3-35 Transportation Expenditures by
- Page 15 and 16: 4-51 Air Pollution Trends in Select
- Page 18: IntroductionCompiled and published
- Page 21: SOURCESU.S. resident population, ag
- Page 25: Table 1-1: System Mileage Within th
- Page 29 and 30: Table 1-5: U.S. Public Road and Str
- Page 31 and 32: Table 1-7: Number of Stations Serve
- Page 33 and 34: Table 1-9: ADA-Accessible Rail Tran
- Page 36: Section BVehicle, Aircraft, andVess
- Page 39 and 40: Table 1-12: U.S. Sales or Deliverie
- Page 41 and 42: Table 1-14: U.S. Automobile and Tru
- Page 43 and 44: Table 1-16: Retail a New Passenger
- Page 45 and 46: Table 1-18: Retail Sales of New Car
- Page 47 and 48: Table 1-20: Period Sales, Market Sh
- Page 49 and 50: Table 1-22: Number of Trucks by Wei
- Page 51 and 52: Taiwan U U U 116 132 124 101 113 11
- Page 53: Section CCondition
- Page 56 and 57: Table 1-26: Average Age of Automobi
- Page 58 and 59: Table 1-28: Condition of U.S. Highw
- Page 60 and 61: Table 1-30: Condition of Urban Bus
- Page 62 and 63: Table 1-32: Class I Railroad Locomo
- Page 64 and 65: Table 1-34: U.S. Flag Vessels by Ty
- Page 66 and 67: Table 1-36: Roadway Vehicle-Miles T
- Page 68 and 69: Table 1-38: Average Length of Haul,
- Page 70 and 71: Table 1-40: U.S. Passenger-Miles (M
- Page 72 and 73: Table 1-42: Long-Distance Travel in
- Page 74 and 75: Table 1-43: Long-Distance Travel in
- Page 76 and 77:
Table 1-45: Air Passenger Travel Ar
- Page 79:
Section DTravel and GoodsMovement
- Page 82 and 83:
Table 1-48: U.S.-Mexican Border Lan
- Page 84 and 85:
Table 1-50: U.S. Ton-Miles of Freig
- Page 86 and 87:
Table 1-52: U.S.-Canadian Border La
- Page 88 and 89:
Table 1-54: U.S.-Mexican Border Lan
- Page 90 and 91:
Table 1-56: U.S. Waterborne Freight
- Page 92 and 93:
Table 1-58: Freight Activity in the
- Page 94 and 95:
Table 1-60: Value of U.S. Land Expo
- Page 96 and 97:
Table 1-61M: Crude Oil and Petroleu
- Page 98:
Table 1-63: U.S. Hazardous Material
- Page 102 and 103:
Table 1-64: Passengers Boarded and
- Page 104 and 105:
Table 1-66: Flight Operations Arriv
- Page 106 and 107:
Table 1-68: Major U.S. Air Carrier
- Page 108 and 109:
Table 1-69: Annual Person-Hours of
- Page 110 and 111:
Table 1-70: Travel Time IndexShort-
- Page 112 and 113:
Table 1-71: Annual Roadway Congesti
- Page 114:
Table 1-73: Amtrak On-Time Performa
- Page 118 and 119:
Table 2-1: Transportation Fatalitie
- Page 120 and 121:
Table 2-3: Transportation Accidents
- Page 122 and 123:
Table 2-5: Highway-Rail Grade-Cross
- Page 124 and 125:
Table 2-7: Transportation-Related O
- Page 127:
Section BAir
- Page 130 and 131:
Table 2-10: U.S. Commuter Air Carri
- Page 132 and 133:
Table 2-12: U.S. Commuter Air Carri
- Page 134 and 135:
Table 2-14: U.S. General Aviation a
- Page 136 and 137:
Table 2-16b: Prohibited Items Inter
- Page 139:
Section CHighway
- Page 142 and 143:
Table 2-18: Motor Vehicle Fatalitie
- Page 144 and 145:
Table 2-20: Occupant and Nonmotoris
- Page 146 and 147:
Table 2-22: Motorcycle Rider Safety
- Page 148 and 149:
Table 2-24: Bus Occupant Safety Dat
- Page 150 and 151:
Table 2-26: Fatalities by Highest B
- Page 152 and 153:
Table 2-28: Motor Vehicle Fatal Cra
- Page 154 and 155:
Table 2-30: Safety Belt and Motorcy
- Page 157:
Section DTransit
- Page 160 and 161:
Table 2-33: Transit Safety Data by
- Page 162 and 163:
d The number of Unlinked passenger
- Page 164 and 165:
Table 2-36: Transit and Grade-Cross
- Page 166 and 167:
Table 2-38: Reports of Violent Crim
- Page 168:
KEY: N = data do not exist.a The ki
- Page 172 and 173:
Table 2-39: Railroad and Grade-Cros
- Page 174 and 175:
Table 2-41: Train Fatalities, Injur
- Page 176 and 177:
Table 2-43: Railroad System Safety
- Page 178:
Section FWater
- Page 181 and 182:
Table 2-46: Waterborne Transportati
- Page 183 and 184:
Table 2-48: Personal Watercraft Saf
- Page 186:
Section GPipeline
- Page 190:
Chapter 3Transportation andthe Econ
- Page 193 and 194:
Table 3-2: U.S. Gross Domestic Prod
- Page 195 and 196:
Table 3-4: U.S. Gross Domestic Prod
- Page 197 and 198:
Table 3-6: U.S. Gross Domestic Dema
- Page 199 and 200:
Table 3-8: Contributions to Gross D
- Page 201 and 202:
Table 3-10: National Transportation
- Page 204 and 205:
Table 3-11: Sales Price of Transpor
- Page 206 and 207:
Table 3-13: Producer Price Indices
- Page 208 and 209:
Table 3-15: Personal Expenditures b
- Page 210 and 211:
Table 3-17: Average Cost of Owning
- Page 212:
Table 3-19: Average Passenger Fares
- Page 216 and 217:
Table 3-20: Average Passenger Reven
- Page 218 and 219:
Table 3-22: Total Operating Revenue
- Page 220 and 221:
Table 3-24: Employment in Transport
- Page 222 and 223:
Table 3-26: Median Weekly Earnings
- Page 224:
Table 3-28: Labor Productivity Indi
- Page 228 and 229:
Table 3-29: Federal, State, and Loc
- Page 230 and 231:
Table 3-31: Summary of Transportati
- Page 232 and 233:
Table 3-33: Transportation Revenues
- Page 234 and 235:
Table 3-35: Transportation Expendit
- Page 236 and 237:
Table 3-37: Federal Transportation
- Page 239:
Chapter 4Transportation, Energy,and
- Page 242 and 243:
Table 4-2: U.S. Consumption of Ener
- Page 245:
Section BTransportation EnergyConsu
- Page 248 and 249:
Table 4-5: Fuel Consumption by Mode
- Page 250 and 251:
Table 4-7: Domestic Demand for Gaso
- Page 252 and 253:
Table 4-9: Motor Vehicle Fuel Consu
- Page 254 and 255:
Table 4-11: Light Duty Vehicle, Sho
- Page 256 and 257:
Table 4-13: Single-Unit 2-Axle 6-Ti
- Page 258 and 259:
Table 4-15: Bus Fuel Consumption an
- Page 260 and 261:
Table 4-17: Class I Rail Freight Fu
- Page 262 and 263:
Table 4-19: U.S. Government Energy
- Page 265 and 266:
Table 4-20: Energy Intensity of Pas
- Page 267 and 268:
Table 4-22: Energy Intensity of Lig
- Page 269 and 270:
Table 4-24: Energy Intensity of Tra
- Page 271 and 272:
Table 4-26: Energy Intensity of Amt
- Page 273 and 274:
Table 4-28: Annual Wasted Fuel Due
- Page 275 and 276:
Table 4-29: Annual Wasted Fuel Per
- Page 278:
Section DAir Pollution
- Page 281 and 282:
Table 4-31: Federal Exhaust Emissio
- Page 283 and 284:
1968-Table 4-33: Federal Exhaust Em
- Page 285 and 286:
Table 4-35: Federal Exhaust Emissio
- Page 287 and 288:
KEY: CO = carbon monoxide; HC = hyd
- Page 289 and 290:
Table 4-38: Federal Exhaust Emissio
- Page 291 and 292:
KEY: CO = carbon monoxide; g = gram
- Page 293 and 294:
KEY: bhp = brake horsepower; bhph =
- Page 295 and 296:
Table 4-42: Tier 2 Federal Exhaust
- Page 297 and 298:
Table 4-44: Estimated National Aver
- Page 299 and 300:
Table 4-46: Estimated National Emis
- Page 301 and 302:
Table 4-48: Estimated National Emis
- Page 303 and 304:
Table 4-50: Estimated National Emis
- Page 305 and 306:
Monmouth-Ocean, NJ 5 21 4 41 34 31
- Page 307 and 308:
Table 4-52: Areas in Nonattainment
- Page 310:
Section EWater Pollution, Noise,and
- Page 313 and 314:
Table 4-55: Leaking Underground Sto
- Page 315 and 316:
Table 4-57: Number of People Residi
- Page 318:
appendix aMetric ConversionTables
- Page 321 and 322:
Table 1-4M: Kilometers of Public Ro
- Page 323 and 324:
Table 1-35M: U.S. Vehicle-Kilometer
- Page 325 and 326:
Table 1-38M: Average Length of Haul
- Page 327 and 328:
a Includes freight, express, and ma
- Page 329 and 330:
Table 1-56M: U.S. Waterborne Freigh
- Page 331 and 332:
Table 4-3M: Domestic Demand for Ref
- Page 333 and 334:
Table 4-6M: Energy Consumption by M
- Page 335 and 336:
Table 4-8M: Certificated Air Carrie
- Page 337 and 338:
Table 4-11M: Light Duty Vehicle, Sh
- Page 339 and 340:
Table 4-13M: Single-Unit 2-Axle 6-T
- Page 341 and 342:
Table 4-15M: Bus Fuel Consumption a
- Page 343 and 344:
Table 4-17M: Class I Rail Freight F
- Page 345 and 346:
Table 4-19M: U.S. Government Energy
- Page 347 and 348:
Table 4-21M: Energy Intensity of Ce
- Page 349 and 350:
Table 4-23M: Average Fuel Efficienc
- Page 351 and 352:
Table 4-25M: Energy Intensity of Cl
- Page 353 and 354:
Appendix B: GlossaryAIR CARRIER: A
- Page 355 and 356:
Appendix B: GlossaryCOLLISION WITH
- Page 357 and 358:
Appendix B: GlossaryFEDERAL ENERGY
- Page 359 and 360:
Appendix B: GlossaryINJURY (Rail):
- Page 361 and 362:
Appendix B: GlossaryMOTOR BUS (Tran
- Page 363 and 364:
Appendix B: GlossaryPERSONAL BUSINE
- Page 365 and 366:
Appendix B: GlossarySUBCOMPACT CAR:
- Page 367 and 368:
appendix cAcronyms and InitialismsA
- Page 370:
appendix dModal Profiles
- Page 373 and 374:
Air Carrier Profile continuedPerfor
- Page 375 and 376:
Air Carrier Profile continuedPerfor
- Page 377 and 378:
Highway ProfileFINANCIAL 1960 1970
- Page 379 and 380:
General Aviation ProfileINVENTORY 1
- Page 381 and 382:
Motorcycle f f f f 50 50 50 50 50 5
- Page 383 and 384:
KEY: R = revised; U = data are unav
- Page 385 and 386:
Transit ProfileFINANCIAL 1960 1970
- Page 387 and 388:
161960-2006: Fatalities and Injured
- Page 389 and 390:
SAFETY d,9Number of fatalities, rai
- Page 391 and 392:
SAFETYFatalities in waterborne tran
- Page 393 and 394:
Natural Gas Pipeline ProfileFINANCI
- Page 395:
appendix eSource andAccuracy Statem
- Page 398 and 399:
agencies receiving funds through th
- Page 400 and 401:
solicitations of all federally regu
- Page 402 and 403:
Passenger Car, Truck, Bus, and Recr
- Page 404 and 405:
Highway, Total (registered vehicles
- Page 406 and 407:
after 1996. Some jurisdictions fail
- Page 408 and 409:
adherence to federal guidelines reg
- Page 410 and 411:
year. Also, expansion factors are u
- Page 412 and 413:
PassengerAir CarrierThe U.S. Depart
- Page 414 and 415:
The data are from Waterborne Commer
- Page 416 and 417:
The Transborder Surface Freight Dat
- Page 418 and 419:
A second data source for air-carrie
- Page 420 and 421:
Appendix EData Source and Accuracy
- Page 422 and 423:
when data are entered, they are che
- Page 424 and 425:
vehicles, and 15 were deleted becau
- Page 426 and 427:
TABLE 2-4. Distribution of Transpor
- Page 428 and 429:
BEA personal consumption expenditur
- Page 430 and 431:
Transportation-related government p
- Page 432 and 433:
information on their data collectio
- Page 434 and 435:
AccuracyAs in all surveys, the accu
- Page 436 and 437:
The American Public Transit Associa
- Page 438 and 439:
Government EmploymentThe Office of
- Page 440 and 441:
specifications or equations, should
- Page 442 and 443:
As mentioned above, the Highway Rev
- Page 444 and 445:
Highway ExpendituresFederal Highway
- Page 446 and 447:
consistency between the different m
- Page 448 and 449:
Appendix EData Source and Accuracy
- Page 450 and 451:
when data are entered, they are che
- Page 452 and 453:
vehicles, and 15 were deleted becau
- Page 454 and 455:
TABLE 2-4. Distribution of Transpor
- Page 456 and 457:
agencies receiving funds through th
- Page 458 and 459:
solicitations of all federally regu
- Page 460 and 461:
Passenger Car, Truck, Bus, and Recr
- Page 462 and 463:
Highway, Total (registered vehicles
- Page 464 and 465:
after 1996. Some jurisdictions fail
- Page 466 and 467:
adherence to federal guidelines reg
- Page 468 and 469:
year. Also, expansion factors are u
- Page 470 and 471:
PassengerAir CarrierThe U.S. Depart
- Page 472 and 473:
The data are from Waterborne Commer
- Page 474 and 475:
The Transborder Surface Freight Dat
- Page 476 and 477:
A second data source for air-carrie
- Page 478 and 479:
Appendix EData Source and Accuracy
- Page 480 and 481:
If transportation had been reviewed
- Page 482 and 483:
Alternative FuelsIn addition to oxy
- Page 484 and 485:
RailThe data are from Railroad Fact
- Page 486 and 487:
multiplied by the average peak peri
- Page 488 and 489:
In general, lead emissions are esti
- Page 490 and 491:
The number of the people exposed to
- Page 492 and 493:
Appendix EData Source and Accuracy
- Page 494 and 495:
If transportation had been reviewed
- Page 496 and 497:
Alternative FuelsIn addition to oxy
- Page 498 and 499:
RailThe data are from Railroad Fact
- Page 500 and 501:
multiplied by the average peak peri
- Page 502 and 503:
In general, lead emissions are esti
- Page 504 and 505:
The number of the people exposed to