SIRS - p-12 - New York State Education Department
SIRS - p-12 - New York State Education Department
SIRS - p-12 - New York State Education Department

You also want an ePaper? Increase the reach of your titles
YUMPU automatically turns print PDFs into web optimized ePapers that Google loves.
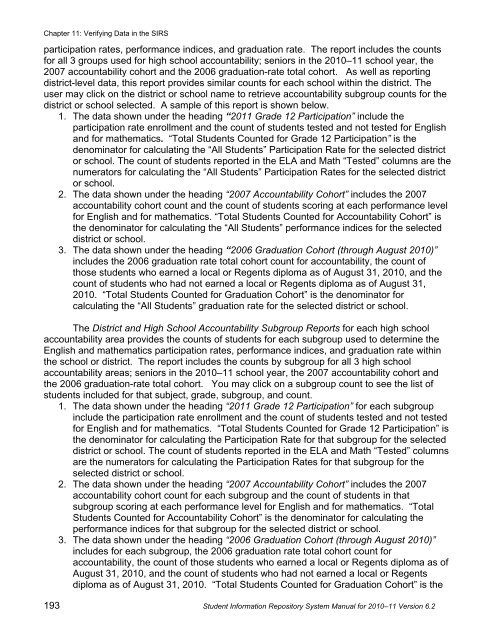
Chapter 11: Verifying Data in the <strong>SIRS</strong><br />
participation rates, performance indices, and graduation rate. The report includes the counts<br />
for all 3 groups used for high school accountability; seniors in the 2010–11 school year, the<br />
2007 accountability cohort and the 2006 graduation-rate total cohort. As well as reporting<br />
district-level data, this report provides similar counts for each school within the district. The<br />
user may click on the district or school name to retrieve accountability subgroup counts for the<br />
district or school selected. A sample of this report is shown below.<br />
1. The data shown under the heading “2011 Grade <strong>12</strong> Participation” include the<br />
participation rate enrollment and the count of students tested and not tested for English<br />
and for mathematics. “Total Students Counted for Grade <strong>12</strong> Participation” is the<br />
denominator for calculating the “All Students” Participation Rate for the selected district<br />
or school. The count of students reported in the ELA and Math “Tested” columns are the<br />
numerators for calculating the “All Students” Participation Rates for the selected district<br />
or school.<br />
2. The data shown under the heading “2007 Accountability Cohort” includes the 2007<br />
accountability cohort count and the count of students scoring at each performance level<br />
for English and for mathematics. “Total Students Counted for Accountability Cohort” is<br />
the denominator for calculating the “All Students” performance indices for the selected<br />
district or school.<br />
3. The data shown under the heading “2006 Graduation Cohort (through August 2010)”<br />
includes the 2006 graduation rate total cohort count for accountability, the count of<br />
those students who earned a local or Regents diploma as of August 31, 2010, and the<br />
count of students who had not earned a local or Regents diploma as of August 31,<br />
2010. “Total Students Counted for Graduation Cohort” is the denominator for<br />
calculating the “All Students” graduation rate for the selected district or school.<br />
The District and High School Accountability Subgroup Reports for each high school<br />
accountability area provides the counts of students for each subgroup used to determine the<br />
English and mathematics participation rates, performance indices, and graduation rate within<br />
the school or district. The report includes the counts by subgroup for all 3 high school<br />
accountability areas; seniors in the 2010–11 school year, the 2007 accountability cohort and<br />
the 2006 graduation-rate total cohort. You may click on a subgroup count to see the list of<br />
students included for that subject, grade, subgroup, and count.<br />
1. The data shown under the heading “2011 Grade <strong>12</strong> Participation” for each subgroup<br />
include the participation rate enrollment and the count of students tested and not tested<br />
for English and for mathematics. “Total Students Counted for Grade <strong>12</strong> Participation” is<br />
the denominator for calculating the Participation Rate for that subgroup for the selected<br />
district or school. The count of students reported in the ELA and Math “Tested” columns<br />
are the numerators for calculating the Participation Rates for that subgroup for the<br />
selected district or school.<br />
2. The data shown under the heading “2007 Accountability Cohort” includes the 2007<br />
accountability cohort count for each subgroup and the count of students in that<br />
subgroup scoring at each performance level for English and for mathematics. “Total<br />
Students Counted for Accountability Cohort” is the denominator for calculating the<br />
performance indices for that subgroup for the selected district or school.<br />
3. The data shown under the heading “2006 Graduation Cohort (through August 2010)”<br />
includes for each subgroup, the 2006 graduation rate total cohort count for<br />
accountability, the count of those students who earned a local or Regents diploma as of<br />
August 31, 2010, and the count of students who had not earned a local or Regents<br />
diploma as of August 31, 2010. “Total Students Counted for Graduation Cohort” is the<br />
193 Student Information Repository System Manual for 2010–11 Version 6.2