
You also want an ePaper? Increase the reach of your titles
YUMPU automatically turns print PDFs into web optimized ePapers that Google loves.
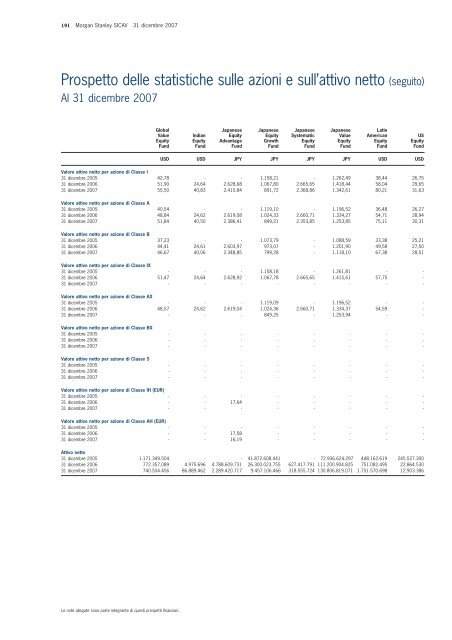
191 Morgan Stanley SICAV 31 dicembre 2007<br />
Prospetto delle statistiche sulle azioni e sull’attivo netto (seguito)<br />
Al 31 dicembre 2007<br />
Global Japanese Japanese Japanese Japanese Latin<br />
Value Indian Equity Equity Systematic Value American US<br />
Equity Equity Advantage Growth Equity Equity Equity Equity<br />
Fund Fund Fund Fund Fund Fund Fund Fund<br />
USD USD JPY JPY JPY JPY USD USD<br />
Valore attivo netto per azione di Classe I<br />
31 dicembre 2005<br />
31 dicembre 2006<br />
31 dicembre 2007<br />
Valore attivo netto per azione di Classe A<br />
31 dicembre 2005<br />
31 dicembre 2006<br />
31 dicembre 2007<br />
Valore attivo netto per azione di Classe B<br />
31 dicembre 2005<br />
31 dicembre 2006<br />
31 dicembre 2007<br />
Valore attivo netto per azione di Classe IX<br />
31 dicembre 2005<br />
31 dicembre 2006<br />
31 dicembre 2007<br />
Valore attivo netto per azione di Classe AX<br />
31 dicembre 2005<br />
31 dicembre 2006<br />
31 dicembre 2007<br />
Valore attivo netto per azione di Classe BX<br />
31 dicembre 2005<br />
31 dicembre 2006<br />
31 dicembre 2007<br />
Valore attivo netto per azione di Classe S<br />
31 dicembre 2005<br />
31 dicembre 2006<br />
31 dicembre 2007<br />
42,78 - - 1.158,21 - 1.262,49 38,44 26,75<br />
51,90 24,64 2.628,68 1.067,80 2.665,65 1.418,44 58,04 29,65<br />
55,50 40,83 2.410,84 891,72 2.368,86 1.342,61 80,21 31,63<br />
40,54 - - 1.119,10 - 1.196,52 36,48 26,27<br />
48,84 24,62 2.619,08 1.024,33 2.660,71 1.334,27 54,71 28,94<br />
51,84 40,50 2.386,41 849,21 2.353,85 1.253,85 75,11 30,31<br />
37,23 - - 1.073,79 - 1.088,59 33,38 25,21<br />
44,41 24,61 2.603,97 973,07 - 1.201,90 49,58 27,50<br />
46,67 40,06 2.348,85 799,28 - 1.118,10 67,38 28,51<br />
- - - 1.158,18 - 1.261,81 - -<br />
51,47 24,64 2.628,92 1.067,78 2.665,65 1.415,61 57,75 -<br />
- - - - - - - -<br />
- - - 1.119,09 - 1.196,52 - -<br />
48,57 24,62 2.619,04 1.024,36 2.660,71 1.334,37 54,59 -<br />
- - - 849,25 - 1.253,94 - -<br />
- - - - - - - -<br />
- - - - - - - -<br />
- - - - - - - -<br />
- - - - - - - -<br />
- - - - - - - -<br />
- - - - - - - -<br />
Valore attivo netto per azione di Classe IH (EUR)<br />
31 dicembre 2005<br />
31 dicembre 2006<br />
31 dicembre 2007<br />
Valore attivo netto per azione di Classe AH (EUR)<br />
31 dicembre 2005<br />
31 dicembre 2006<br />
31 dicembre 2007<br />
- - - - - - - -<br />
- - 17,64 - - - - -<br />
- - - - - - - -<br />
- - - - - - - -<br />
- - 17,58 - - - - -<br />
- - 16,19 - - - - -<br />
Attivo netto<br />
31 dicembre 2005<br />
31 dicembre 2006<br />
31 dicembre 2007<br />
1.171.349.504 - - 41.872.608.441 - 72.936.624.297 448.162.619 245.527.300<br />
772.357.089 4.975.696 4.788.609.731 26.300.023.755 627.417.791 111.200.904.825 751.082.495 22.864.530<br />
740.504.456 86.889.462 2.289.420.717 9.457.106.466 318.555.724 130.806.819.071 1.751.570.698 12.903.386<br />
Le note allegate sono parte integrante di questi prospetti finanziari.