valorizzazione degli effluenti di allevamento e loro gestione ... - ARAL
valorizzazione degli effluenti di allevamento e loro gestione ... - ARAL
valorizzazione degli effluenti di allevamento e loro gestione ... - ARAL
- No tags were found...

You also want an ePaper? Increase the reach of your titles
YUMPU automatically turns print PDFs into web optimized ePapers that Google loves.
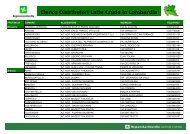
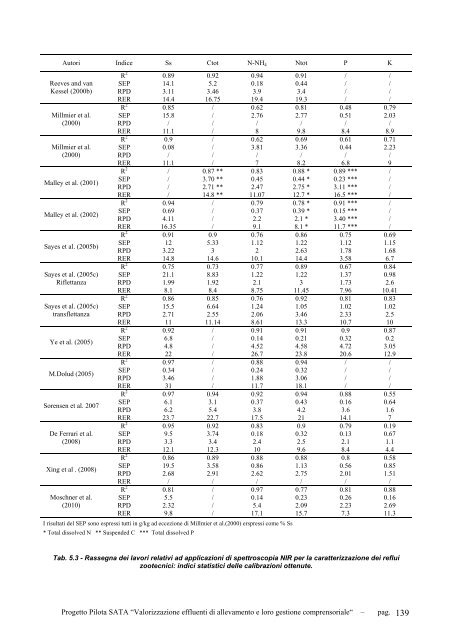
Autori In<strong>di</strong>ce Ss Ctot N-NH 4 Ntot P KReeves and vanKessel (2000b)Millmier et al.(2000)Millmier et al.(2000)Malley et al. (2001)Malley et al. (2002)Sayes et al. (2005b)Sayes et al. (2005c)RiflettanzaSayes et al. (2005c)transflettanzaYe et al. (2005)M.Dolud (2005)Sorensen et al. 2007De Ferrari et al.(2008)Xing et al . (2008)Moschner et al.(2010)R 2 0.89 0.92 0.94 0.91 / /SEP 14.1 5.2 0.18 0.44 / /RPD 3.11 3.46 3.9 3.4 / /RER 14.4 16.75 19.4 19.3 / /R 2 0.85 / 0.62 0.81 0.48 0.79SEP 15.8 / 2.76 2.77 0.51 2.03RPD / / / / / /RER 11.1 / 8 9.8 8.4 8.9R 2 0.9 / 0.62 0.69 0.61 0.71SEP 0.08 / 3.81 3.36 0.44 2.23RPD / / / / / /RER 11.1 / 7 8.2 6.8 9R 2 / 0.87 ** 0.83 0.88 * 0.89 *** /SEP / 3.70 ** 0.45 0.44 * 0.23 *** /RPD / 2.71 ** 2.47 2.75 * 3.11 *** /RER / 14.8 ** 11.07 12.7 * 16.5 *** /R 2 0.94 / 0.79 0.78 * 0.91 *** /SEP 0.69 / 0.37 0.39 * 0.15 *** /RPD 4.11 / 2.2 2.1 * 3.40 *** /RER 16.35 / 9.1 8.1 * 11.7 *** /R 2 0.91 0.9 0.76 0.86 0.75 0.69SEP 12 5.33 1.12 1.22 1.12 1.15RPD 3.22 3 2 2.63 1.78 1.68RER 14.8 14.6 10.1 14.4 3.58 6.7R 2 0.75 0.73 0.77 0.89 0.67 0.84SEP 21.1 8.83 1.22 1.22 1.37 0.98RPD 1.99 1.92 2.1 3 1.73 2.6RER 8.1 8.4 8.75 11.45 7.96 10.41R 2 0.86 0.85 0.76 0.92 0.81 0.83SEP 15.5 6.64 1.24 1.05 1.02 1.02RPD 2.71 2.55 2.06 3.46 2.33 2.5RER 11 11.14 8.61 13.3 10.7 10R 2 0.92 / 0.91 0.91 0.9 0.87SEP 6.8 / 0.14 0.21 0.32 0.2RPD 4.8 / 4.52 4.58 4.72 3.05RER 22 / 26.7 23.8 20.6 12.9R 2 0.97 / 0.88 0.94 / /SEP 0.34 / 0.24 0.32 / /RPD 3.46 / 1.88 3.06 / /RER 31 / 11.7 18.1 / /R 2 0.97 0.94 0.92 0.94 0.88 0.55SEP 6.1 3.1 0.37 0.43 0.16 0.64RPD 6.2 5.4 3.8 4.2 3.6 1.6RER 23.7 22.7 17.5 21 14.1 7R 2 0.95 0.92 0.83 0.9 0.79 0.19SEP 9.5 3.74 0.18 0.32 0.13 0.67RPD 3.3 3.4 2.4 2.5 2.1 1.1RER 12.1 12.3 10 9.6 8.4 4.4R 2 0.86 0.89 0.88 0.88 0.8 0.58SEP 19.5 3.58 0.86 1.13 0.56 0.85RPD 2.68 2.91 2.62 2.75 2.01 1.51RER / / / / / /R 2 0.81 / 0.97 0.77 0.81 0.88SEP 5.5 / 0.14 0.23 0.26 0.16RPD 2.32 / 5.4 2.09 2.23 2.69RER 9.8 / 17.1 15.7 7.3 11.3I risultati del SEP sono espressi tutti in g/kg ad eccezione <strong>di</strong> Millmier et al.(2000) erspressi come % Ss* Total <strong>di</strong>ssolved N ** Suspended C *** Total <strong>di</strong>ssolved PTab. 5.3 - Rassegna dei lavori relativi ad applicazioni <strong>di</strong> spettroscopia NIR per la caratterizzazione dei refluizootecnici: in<strong>di</strong>ci statistici delle calibrazioni ottenute.Progetto Pilota SATA “Valorizzazione <strong>effluenti</strong> <strong>di</strong> <strong>allevamento</strong> e <strong>loro</strong> <strong>gestione</strong> comprensoriale“ – pag. 139