The Gougeon Brothers on Boat Construction - WEST SYSTEM Epoxy
The Gougeon Brothers on Boat Construction - WEST SYSTEM Epoxy
The Gougeon Brothers on Boat Construction - WEST SYSTEM Epoxy

Create successful ePaper yourself
Turn your PDF publications into a flip-book with our unique Google optimized e-Paper software.
380 Appendices<br />
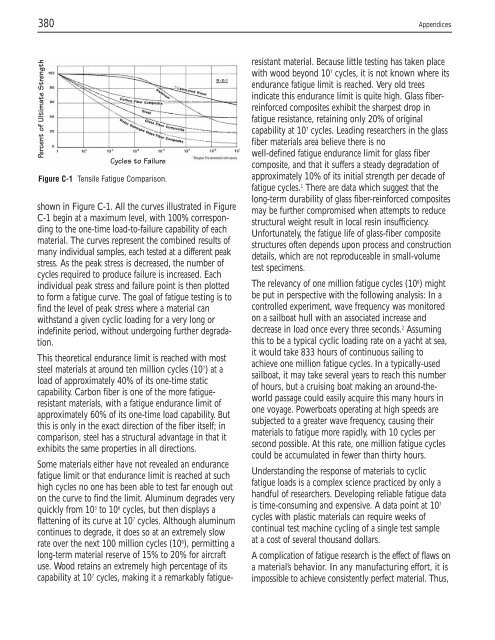
Percent of Ultimate Strength<br />
Cycles to Failure<br />
Figure C-1 Tensile Fatigue Comparis<strong>on</strong>.<br />
shown in Figure C-1. All the curves illustrated in Figure<br />
C-1 begin at a maximum level, with 100% corresp<strong>on</strong>ding<br />
to the <strong>on</strong>e-time load-to-failure capability of each<br />
material. <str<strong>on</strong>g>The</str<strong>on</strong>g> curves represent the combined results of<br />
many individual samples, each tested at a different peak<br />
stress. As the peak stress is decreased, the number of<br />
cycles required to produce failure is increased. Each<br />
individual peak stress and failure point is then plotted<br />
to form a fatigue curve. <str<strong>on</strong>g>The</str<strong>on</strong>g> goal of fatigue testing is to<br />
find the level of peak stress where a material can<br />
withstand a given cyclic loading for a very l<strong>on</strong>g or<br />
indefinite period, without undergoing further degradati<strong>on</strong>.<br />
This theoretical endurance limit is reached with most<br />
steel materials at around ten milli<strong>on</strong> cycles (107 ) at a<br />
load of approximately 40% of its <strong>on</strong>e-time static<br />
capability. Carb<strong>on</strong> fiber is <strong>on</strong>e of the more fatigueresistant<br />
materials, with a fatigue endurance limit of<br />
approximately 60% of its <strong>on</strong>e-time load capability. But<br />
this is <strong>on</strong>ly in the exact directi<strong>on</strong> of the fiber itself; in<br />
comparis<strong>on</strong>, steel has a structural advantage in that it<br />
exhibits the same properties in all directi<strong>on</strong>s.<br />
Some materials either have not revealed an endurance<br />
fatigue limit or that endurance limit is reached at such<br />
high cycles no <strong>on</strong>e has been able to test far enough out<br />
<strong>on</strong> the curve to find the limit. Aluminum degrades very<br />
quickly from 103 to 106 cycles, but then displays a<br />
flattening of its curve at 107 cycles. Although aluminum<br />
c<strong>on</strong>tinues to degrade, it does so at an extremely slow<br />
rate over the next 100 milli<strong>on</strong> cycles (108 ), permitting a<br />
l<strong>on</strong>g-term material reserve of 15% to 20% for aircraft<br />
use. Wood retains an extremely high percentage of its<br />
capability at 107 cycles, making it a remarkably fatigue-<br />
resistant material. Because little testing has taken place<br />
with wood bey<strong>on</strong>d 107 cycles, it is not known where its<br />
endurance fatigue limit is reached. Very old trees<br />
indicate this endurance limit is quite high. Glass fiberreinforced<br />
composites exhibit the sharpest drop in<br />
fatigue resistance, retaining <strong>on</strong>ly 20% of original<br />
capability at 107 cycles. Leading researchers in the glass<br />
fiber materials area believe there is no<br />
well-defined fatigue endurance limit for glass fiber<br />
composite, and that it suffers a steady degradati<strong>on</strong> of<br />
approximately 10% of its initial strength per decade of<br />
fatigue cycles. 1 <str<strong>on</strong>g>The</str<strong>on</strong>g>re are data which suggest that the<br />
l<strong>on</strong>g-term durability of glass fiber-reinforced composites<br />
may be further compromised when attempts to reduce<br />
structural weight result in local resin insufficiency.<br />
Unfortunately, the fatigue life of glass-fiber composite<br />
structures often depends up<strong>on</strong> process and c<strong>on</strong>structi<strong>on</strong><br />
details, which are not reproduceable in small-volume<br />
test specimens.<br />
<str<strong>on</strong>g>The</str<strong>on</strong>g> relevancy of <strong>on</strong>e milli<strong>on</strong> fatigue cycles (106 ) might<br />
be put in perspective with the following analysis: In a<br />
c<strong>on</strong>trolled experiment, wave frequency was m<strong>on</strong>itored<br />
<strong>on</strong> a sailboat hull with an associated increase and<br />
decrease in load <strong>on</strong>ce every three sec<strong>on</strong>ds. 2 Assuming<br />
this to be a typical cyclic loading rate <strong>on</strong> a yacht at sea,<br />
it would take 833 hours of c<strong>on</strong>tinuous sailing to<br />
achieve <strong>on</strong>e milli<strong>on</strong> fatigue cycles. In a typically-used<br />
sailboat, it may take several years to reach this number<br />
of hours, but a cruising boat making an around-theworld<br />
passage could easily acquire this many hours in<br />
<strong>on</strong>e voyage. Powerboats operating at high speeds are<br />
subjected to a greater wave frequency, causing their<br />
materials to fatigue more rapidly, with 10 cycles per<br />
sec<strong>on</strong>d possible. At this rate, <strong>on</strong>e milli<strong>on</strong> fatigue cycles<br />
could be accumulated in fewer than thirty hours.<br />
Understanding the resp<strong>on</strong>se of materials to cyclic<br />
fatigue loads is a complex science practiced by <strong>on</strong>ly a<br />
handful of researchers. Developing reliable fatigue data<br />
is time-c<strong>on</strong>suming and expensive. A data point at 107 cycles with plastic materials can require weeks of<br />
c<strong>on</strong>tinual test machine cycling of a single test sample<br />
at a cost of several thousand dollars.<br />
A complicati<strong>on</strong> of fatigue research is the effect of flaws <strong>on</strong><br />
a material’s behavior. In any manufacturing effort, it is<br />
impossible to achieve c<strong>on</strong>sistently perfect material. Thus,