statistique, théorie et gestion de portefeuille - Docs at ISFA
statistique, théorie et gestion de portefeuille - Docs at ISFA
statistique, théorie et gestion de portefeuille - Docs at ISFA

Create successful ePaper yourself
Turn your PDF publications into a flip-book with our unique Google optimized e-Paper software.
170 6. Comportements mimétiques <strong>et</strong> antagonistes : bulles hyperboliques, krachs <strong>et</strong> chaos<br />
Q UANTITATIVE F INANCE Imit<strong>at</strong>ion and contrarian behaviour: hyperbolic bubbles, crashes and chaos<br />
Probability<br />
1.0<br />
0.9<br />
0.8<br />
0.7<br />
0.6<br />
0.5<br />
0.4<br />
0.3<br />
0.2<br />
0.1<br />
Effect of periodic orbits<br />
0.0<br />
–0.4 –0.3 –0.2 –0.1 0.0 0.1 0.2 0.3 0.4<br />
p–1/2<br />
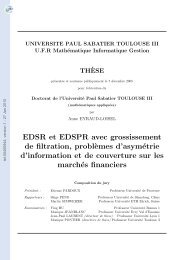
Figure 9. Cumul<strong>at</strong>ive distribution for m = 60 polled agents and the<br />
param<strong>et</strong>ers ρhb = ρbh = 0.72 and ρhh = ρbb = 0.85.<br />
the other cases, we cannot conclu<strong>de</strong> on the existence of a<br />
power-law regime, but it is obvious th<strong>at</strong> the tail behaviour of<br />
the distribution function <strong>de</strong>pends on the number m of polled<br />
agents.<br />
Figure 11 shows the behaviour of the autocorrel<strong>at</strong>ion<br />
function for m = 60 and 100, with the same values of the<br />
other param<strong>et</strong>ers ρhb = ρbh = 0.72 and ρhh = ρbb = 0.85.<br />
For m = 100, the presence of the weakly unstable orbits is felt<br />
much stronger, which is reflected in (i) a very strong periodic<br />
component of the correl<strong>at</strong>ion function and (ii) its slow <strong>de</strong>cay.<br />
Even for m = 60, the correl<strong>at</strong>ion function does not <strong>de</strong>cay<br />
fast enough compared to the typical dur<strong>at</strong>ion of specul<strong>at</strong>ive<br />
bubbles to be in quantit<strong>at</strong>ive agreement with empirical d<strong>at</strong>a.<br />
This anomalously large correl<strong>at</strong>ion of the r<strong>et</strong>urns is obviously<br />
rel<strong>at</strong>ed to the d<strong>et</strong>erministic dynamics of the r<strong>et</strong>urns. We thus<br />
expect th<strong>at</strong> including stochastic noise due to a finite number N<br />
of agents (see below) and adding external noise due to ‘news’<br />
will whiten rt significantly.<br />
Figure 12 compares the correl<strong>at</strong>ion function for the r<strong>et</strong>urns<br />
time series rt ∝ pt − 1/2 and the vol<strong>at</strong>ility time series <strong>de</strong>fined<br />
as |rt|. The vol<strong>at</strong>ility is an important measure of risks and thus<br />
plays an important role in portfolio managements and option<br />
pricing and hedging. Note th<strong>at</strong> taking the absolute value of the<br />
r<strong>et</strong>urn removes the one source of irregularity stemming from<br />
the change of sign of rt ∝ pt − 1/2 to focus on the local<br />
amplitu<strong>de</strong>s. We observe in figure 12 a significantly longer<br />
correl<strong>at</strong>ion time for the vol<strong>at</strong>ility. Moreover, the correl<strong>at</strong>ion<br />
function of the vol<strong>at</strong>ility first <strong>de</strong>cays exponentially and then as a<br />
power law. This behaviour has previously been documented in<br />
many econom<strong>et</strong>ric works (Ding <strong>et</strong> al 1993, Ding and Granger<br />
1996, Müller <strong>et</strong> al 1997, Dacorogna <strong>et</strong> al 1998, Arneodo <strong>et</strong> al<br />
1998, Ballocchi <strong>et</strong> al 1999, Muzy <strong>et</strong> al 2001).<br />
6. Asymm<strong>et</strong>ric cases<br />
We have seen th<strong>at</strong> the symm<strong>et</strong>ric case ρhb = ρbh and ρhh = ρbb<br />
is plagued by the weakly unstable periodic orbits which put a<br />
Probability<br />
10 0<br />
10 –1<br />
10 –5<br />
m = 30<br />
m = 60<br />
m = 100<br />
10 –4 10 –3<br />
Survival distribution<br />
10 –2<br />
1/2–p<br />
10 –1<br />
Figure 10. Survival (i.e. complementary cumul<strong>at</strong>ive) distribution<br />
for m = 30, 60 and 100 polled ‘friends’ per agent and param<strong>et</strong>ers<br />
ρhb = ρbh = 0.72 and ρhh = ρbb = 0.85. The total number N of<br />
agents is infinite.<br />
strong and unrealistic imprint on the st<strong>at</strong>istical properties of<br />
the r<strong>et</strong>urn time series. It is n<strong>at</strong>ural to argue th<strong>at</strong> breaking the<br />
symm<strong>et</strong>ry will <strong>de</strong>stroy the strength of these periodic orbits.<br />
From a behavioural point of view, it is also quite clear th<strong>at</strong><br />
the <strong>at</strong>titu<strong>de</strong> of an investor is not symm<strong>et</strong>ric. One can expect<br />
a priori a stronger bullish buy-and-hold in<strong>de</strong>x ρhb − 1/2 than<br />
bearish buy-and-hold in<strong>de</strong>x ρbh − 1/2: one is a priori more<br />
prone to hold a position in a bullish mark<strong>et</strong> than in a bearish one.<br />
Similarly, we expect a smaller bullish reversal in<strong>de</strong>x 1 − ρhh<br />
than bearish reversal in<strong>de</strong>x 1 − ρbb: specul<strong>at</strong>ive bubbles are<br />
rarely seen on downward trends as it is much more common<br />
th<strong>at</strong> increasing prices are favourably perceived and can be sustained<br />
much longer without reference to the fundamental price.<br />
Such an asymm<strong>et</strong>ry has been clearly <strong>de</strong>monstr<strong>at</strong>ed<br />
empirically in the difference b<strong>et</strong>ween the r<strong>at</strong>e of occurrence<br />
and size of extreme drawdowns compared to drawups in stock<br />
mark<strong>et</strong> time series (Johansen and Sorn<strong>et</strong>te 2001). Drawdowns<br />
(drawups) are <strong>de</strong>fined as the cumul<strong>at</strong>ive losses (gains) from<br />
the last local maximum (minimum) to the next local minimum<br />
(maximum). Drawdowns and drawups are very interesting<br />
because they offer a more n<strong>at</strong>ural measure of real mark<strong>et</strong> risks<br />
than the variance, the value-<strong>at</strong>-risk or other measures based<br />
on fixed time scale distributions of r<strong>et</strong>urns. For the major<br />
stock mark<strong>et</strong> indices, there are very large drawdowns which are<br />
‘outliers’ while drawups do not exhibit such a drastic change<br />
of regime. For major companies, drawups of amplitu<strong>de</strong> larger<br />
than 15% occur <strong>at</strong> a r<strong>at</strong>e about twice as large as the r<strong>at</strong>e of<br />
drawdowns, but with lower absolute amplitu<strong>de</strong>. An asymm<strong>et</strong>ry<br />
ρhh = ρbb could result from the mechanism of asymm<strong>et</strong>ric<br />
inform<strong>at</strong>ion, in which actors on one si<strong>de</strong> of the mark<strong>et</strong> have<br />
b<strong>et</strong>ter inform<strong>at</strong>ion than those on the other (see Riley (2001) for<br />
a survey of <strong>de</strong>velopments in the economics of inform<strong>at</strong>ion over<br />
the last 25 years and The Bank of Swe<strong>de</strong>n Prize in Economics<br />
Sciences in Memory of Alfred Nobel 2001, document entitled<br />
‘Mark<strong>et</strong>s with Asymm<strong>et</strong>ric Inform<strong>at</strong>ion’, 10 October 2001).<br />
10 0<br />
273