statistique, théorie et gestion de portefeuille - Docs at ISFA
statistique, théorie et gestion de portefeuille - Docs at ISFA
statistique, théorie et gestion de portefeuille - Docs at ISFA

You also want an ePaper? Increase the reach of your titles
YUMPU automatically turns print PDFs into web optimized ePapers that Google loves.
174 6. Comportements mimétiques <strong>et</strong> antagonistes : bulles hyperboliques, krachs <strong>et</strong> chaos<br />
Q UANTITATIVE F INANCE Imit<strong>at</strong>ion and contrarian behaviour: hyperbolic bubbles, crashes and chaos<br />
1.0<br />
0.9<br />
0.8<br />
0.7<br />
0.6<br />
p¢ 0.5<br />
0.4<br />
0.3<br />
0.2<br />
0.1<br />
0.0<br />
0.0 0.1 0.2 0.3 0.4 0.5 0.6 0.7 0.8 0.9 1.0<br />
p<br />
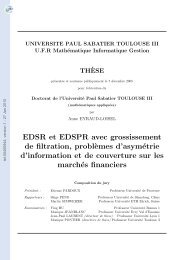
Figure 18. R<strong>et</strong>urn map of the fraction of bullish agents for m = 60<br />
polled agents among N = 61 agents (points) and the d<strong>et</strong>erministic<br />
trajectory (continuous curve) corresponding to N =∞agents. The<br />
param<strong>et</strong>ers are ρhb = ρbh = 0.72 and ρhh = ρbb = 0.85.<br />
agents in the mark<strong>et</strong> (this is realistic) and they are in contact<br />
with only m other agents th<strong>at</strong> they poll <strong>at</strong> each time period. Not<br />
knowing the true value of N but assuming it to be large, it is<br />
r<strong>at</strong>ional for them to <strong>de</strong>velop the best predictor of the dynamics<br />
by assuming the i<strong>de</strong>al case of an infinite number of agents with<br />
m polled agents and thus use the d<strong>et</strong>erministic dynamics (2) as<br />
their best predictor.<br />
At each time period t, each agent thus chooses randomly<br />
m agents th<strong>at</strong> she polls. She then counts the number of bullish<br />
and bearish agents among her polled sample of m agents.<br />
This number divi<strong>de</strong>d by m gives her an estim<strong>at</strong>ion ˆpt of<br />
the probability pt being bullish <strong>at</strong> time t. Introducing this<br />
estim<strong>at</strong>ion in the d<strong>et</strong>erministic equ<strong>at</strong>ion (2), the agent obtains<br />
a forecast ˆp ′ of the true probability p ′ being bullish <strong>at</strong> the next<br />
time step.<br />
Results of the simul<strong>at</strong>ions of this mo<strong>de</strong>l are shown in figure<br />
21. We observe a significantly stronger ‘noise’ compared<br />
to the previous section, which is expected since the noise is<br />
itself injected in the dynamical equ<strong>at</strong>ion <strong>at</strong> each time step. As<br />
a consequence, the correl<strong>at</strong>ion function of the r<strong>et</strong>urns and of<br />
the vol<strong>at</strong>ility <strong>de</strong>cay faster than their d<strong>et</strong>erministic counterpart.<br />
The correl<strong>at</strong>ion of the vol<strong>at</strong>ility still <strong>de</strong>cays about ten times<br />
slower than the correl<strong>at</strong>ion of the r<strong>et</strong>urns, but this clustering of<br />
vol<strong>at</strong>ility is not sufficiently strong compared to empirical facts.<br />
As in the <strong>de</strong>finition of the mo<strong>de</strong>l presented in section 2,<br />
we use here again a ‘mean-field’ approxim<strong>at</strong>ion, valid only if<br />
each agent selects randomly her m agents to w<strong>at</strong>ch, with a new<br />
selection compl<strong>et</strong>ely in<strong>de</strong>pen<strong>de</strong>nt of the previous one ma<strong>de</strong> <strong>at</strong><br />
every new time step. This unrealistic but simplifying fe<strong>at</strong>ure<br />
is the one we have followed in our simul<strong>at</strong>ions. If each agent<br />
has some neighbouring agents which she will w<strong>at</strong>ch again<br />
and again, then correl<strong>at</strong>ions will build up which are ignored<br />
compl<strong>et</strong>ely here; some correl<strong>at</strong>ions of this type are presumably<br />
more realistic. This is left for future works.<br />
Other more realistic mo<strong>de</strong>ls of a finite number of agents<br />
can be introduced. For instance, <strong>at</strong> time t, consi<strong>de</strong>r an agent<br />
1.0<br />
0.9<br />
0.8<br />
0.7<br />
0.6<br />
p¢<br />
0.5<br />
0.4<br />
0.3<br />
0.2<br />
0.1<br />
0.0<br />
0.0 0.1 0.2 0.3 0.4 0.5<br />
p<br />
0.6 0.7 0.8 0.9 1.0<br />
Figure 19. R<strong>et</strong>urn map of the fraction of bullish agents for m = 60<br />
polled agents among N = 600 agents (points) and the d<strong>et</strong>erministic<br />
trajectory (continuous curve) corresponding to N =∞agents. The<br />
param<strong>et</strong>ers are ρhb = ρbh = 0.72 and ρhh = ρbb = 0.85.<br />
among the N. She chooses m other agents randomly and<br />
polls them. Each of them is either bullish or bearish as a<br />
result of <strong>de</strong>cisions taken during the previous time period. She<br />
then counts the number of bullish agents among the m, and<br />
then d<strong>et</strong>ermines her new <strong>at</strong>titu<strong>de</strong> using the rules (1). If she is<br />
polled <strong>at</strong> time t + 1 by another agent, her <strong>at</strong>titu<strong>de</strong> will be the<br />
one d<strong>et</strong>ermined from t to t + 1. In this way, we never refer<br />
to the d<strong>et</strong>erministic dynamics pt but only to its un<strong>de</strong>rlying<br />
rules. As a consequence, this d<strong>et</strong>erministic dynamics does<br />
not exert an <strong>at</strong>traction th<strong>at</strong> minimizes the effect of st<strong>at</strong>istical<br />
fluctu<strong>at</strong>ions due to finite sizes. This approach is similar to<br />
going from a Fokker–Planck equ<strong>at</strong>ion (equ<strong>at</strong>ion (2)) to a<br />
Langevin equ<strong>at</strong>ion with finite-size effects. This class of mo<strong>de</strong>ls<br />
will be investig<strong>at</strong>ed elsewhere.<br />
8. Conclusions<br />
The traditional concept of stock mark<strong>et</strong> dynamics envisions a<br />
stream of stochastic ‘news’ th<strong>at</strong> may move prices in random<br />
directions. This paper, in contrast, <strong>de</strong>monstr<strong>at</strong>es th<strong>at</strong> certain<br />
types of d<strong>et</strong>erministic behaviour—mimicry and contradictory<br />
behaviour alone—can already lead to chaotic prices.<br />
If the mark<strong>et</strong> prices are assumed to follow the pt<br />
behaviour, our <strong>de</strong>scription refers to the well-known evolution<br />
of the specul<strong>at</strong>ive bubbles. Such apparent regularities often<br />
occur in the stock mark<strong>et</strong> and form the basis of the so-called<br />
‘technical analysis’ whereby tra<strong>de</strong>rs <strong>at</strong>tempt to predict future<br />
price movements by extrapol<strong>at</strong>ing certain p<strong>at</strong>terns from recent<br />
historical prices. Our mo<strong>de</strong>l provi<strong>de</strong>s an explan<strong>at</strong>ion of birth,<br />
life and <strong>de</strong><strong>at</strong>h of the specul<strong>at</strong>ive bubbles in this context.<br />
While the traditional theory of r<strong>at</strong>ional anticip<strong>at</strong>ions<br />
exhibits and emphasizes self-reinforcing mechanisms, without<br />
either predicting their inception nor their collapse, the strength<br />
of our mo<strong>de</strong>l is to justify the occurrence of specul<strong>at</strong>ive<br />
bubbles. It allows for their collapse by taking into account<br />
277