- Page 1:
UNIVERSITE DE NICE-SOPHIA ANTIPOLIS
- Page 4 and 5:
4 Table des matières 2.2.2 Bulles
- Page 6 and 7:
6 Table des matières 7.3.2 Tests n
- Page 8 and 9:
8 Table des matières 12.1.1 Distri
- Page 10 and 11:
10 Table des matières Références
- Page 12 and 13:
12 m’ont souvent été d’un gra
- Page 14 and 15:
14 Introduction pour espérer se co
- Page 16 and 17:
16 Introduction les distributions e
- Page 18 and 19:
18 Introduction
- Page 21 and 22:
Chapitre 1 Faits stylisés des rent
- Page 23 and 24:
1.1. Rappel des faits stylisés 23
- Page 25 and 26:
1.1. Rappel des faits stylisés 25
- Page 27 and 28:
1.2. De la difficulté de représen
- Page 29 and 30:
1.3. Modélisation des propriétés
- Page 31 and 32:
Chapitre 2 Modèles phénoménologi
- Page 33 and 34:
2.1. Bulles rationnelles multi-dime
- Page 35 and 36:
2.1. Bulles rationnelles multi-dime
- Page 37 and 38:
2.1. Bulles rationnelles multi-dime
- Page 39 and 40:
2.1. Bulles rationnelles multi-dime
- Page 41 and 42:
2.1. Bulles rationnelles multi-dime
- Page 43 and 44:
2.2. Des bulles rationnelles aux kr
- Page 45 and 46: 2.2. Des bulles rationnelles aux kr
- Page 47 and 48: 2.2. Des bulles rationnelles aux kr
- Page 49 and 50: 2.2. Des bulles rationnelles aux kr
- Page 51 and 52: 2.2. Des bulles rationnelles aux kr
- Page 53 and 54: 2.2. Des bulles rationnelles aux kr
- Page 55 and 56: 2.2. Des bulles rationnelles aux kr
- Page 57 and 58: 2.2. Des bulles rationnelles aux kr
- Page 59 and 60: 2.2. Des bulles rationnelles aux kr
- Page 61 and 62: 2.2. Des bulles rationnelles aux kr
- Page 63 and 64: Chapitre 3 Distributions exponentie
- Page 65 and 66: Empirical Distributions of Log-Retu
- Page 67 and 68: concerning tail fatness can be form
- Page 69 and 70: To fit our two data sets, section 4
- Page 71 and 72: properties, stressing the problems
- Page 73 and 74: Another problem lies in the determi
- Page 75 and 76: In order to obtain a process with S
- Page 77 and 78: and Sornette (1999) for instance. W
- Page 79 and 80: 1. The Pareto distribution: 79 Fu(x
- Page 81 and 82: empirical analog FN(x), estimated f
- Page 83 and 84: have been chosen to converge to 1 a
- Page 85 and 86: 5 Comparison of the descriptive pow
- Page 87 and 88: ased on the fact that the quantity
- Page 89 and 90: tail (positive or negative) of the
- Page 91 and 92: Equation (46) depends on c only and
- Page 93 and 94: B Minimum Anderson-Darling Estimato
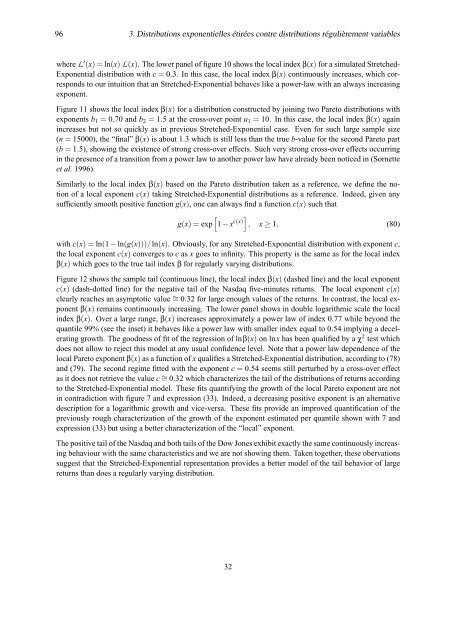
- Page 95: C Local exponent In this Appendix,
- Page 99 and 100: where α = (c ∗ ,d ∗ ). It can
- Page 101 and 102: where E0[·] denotes the expectatio
- Page 103 and 104: References Andersen, J.V. and D. So
- Page 105 and 106: Gouriéroux C. and A. Monfort, 1994
- Page 107 and 108: Rubinstein, M., 1973, The fundament
- Page 109 and 110: (a) Independent Data Stretched-Expo
- Page 111 and 112: (a) Dow Jones Positive Tail Negativ
- Page 113 and 114: Nasdaq Dow Jones Pos. Tail Neg. Tai
- Page 115 and 116: Nasdaq Dow Jones Pos. Tail Neg. Tai
- Page 117 and 118: Nasdaq Dow Jones Pos. Tail Neg. Tai
- Page 119 and 120: Nasdaq Dow Jones Pos. Tail Neg. Tai
- Page 121 and 122: Dow Jones positive tail Dow Jones n
- Page 123 and 124: Variation coefficient Variation coe
- Page 125 and 126: Mean excess function Mean excess fu
- Page 127 and 128: Hill‘s estimate b u Hill‘s esti
- Page 129 and 130: Wilks statistic (doubled log−like
- Page 131 and 132: Tail 1−F(x) and parameter b Tail
- Page 133 and 134: 1.4 1.2 1 0.8 0.6 0.4 0.2 0 1 2 3 4
- Page 135 and 136: Chapitre 4 Relaxation de la volatil
- Page 137 and 138: Volatility Fingerprints of Large Sh
- Page 139 and 140: 2 Long-range memory and distinction
- Page 141 and 142: Figure 2: Measuring the conditional
- Page 143 and 144: the system to the accumulation of m
- Page 145 and 146: Appendix C: “Conditional response
- Page 147 and 148:
Baillie, R.T., 1996, Long memory pr
- Page 149 and 150:
Chapitre 5 Approche comportementale
- Page 151 and 152:
5.1. Prix d’un actif et excès de
- Page 153 and 154:
5.2. Modèles d’opinion contre mo
- Page 155 and 156:
5.4. Conséquences des phénomènes
- Page 157 and 158:
5.5. Conclusion 157 ce qui induit u
- Page 159 and 160:
Chapitre 6 Comportements mimétique
- Page 161 and 162:
RESEARCH PAPER Q UANTITATIVE F INAN
- Page 163 and 164:
A Corcos et al Q UANTITATIVE F INAN
- Page 165 and 166:
A Corcos et al Q UANTITATIVE F INAN
- Page 167 and 168:
A Corcos et al Q UANTITATIVE F INAN
- Page 169 and 170:
A Corcos et al Q UANTITATIVE F INAN
- Page 171 and 172:
A Corcos et al Q UANTITATIVE F INAN
- Page 173 and 174:
A Corcos et al Q UANTITATIVE F INAN
- Page 175 and 176:
A Corcos et al Q UANTITATIVE F INAN
- Page 177 and 178:
A Corcos et al Q UANTITATIVE F INAN
- Page 179:
Deuxième partie Etude des proprié
- Page 182 and 183:
182 7. Etude de la dépendance à l
- Page 184 and 185:
184 7. Etude de la dépendance à l
- Page 186 and 187:
186 7. Etude de la dépendance à l
- Page 188 and 189:
188 7. Etude de la dépendance à l
- Page 190 and 191:
190 7. Etude de la dépendance à l
- Page 192 and 193:
192 8. Tests de copule gaussienne
- Page 194 and 195:
194 8. Tests de copule gaussienne 1
- Page 196 and 197:
196 8. Tests de copule gaussienne
- Page 198 and 199:
198 8. Tests de copule gaussienne 2
- Page 200 and 201:
200 8. Tests de copule gaussienne t
- Page 202 and 203:
202 8. Tests de copule gaussienne T
- Page 204 and 205:
204 8. Tests de copule gaussienne a
- Page 206 and 207:
206 8. Tests de copule gaussienne c
- Page 208 and 209:
208 8. Tests de copule gaussienne t
- Page 210 and 211:
210 8. Tests de copule gaussienne (
- Page 212 and 213:
212 8. Tests de copule gaussienne R
- Page 214 and 215:
214 8. Tests de copule gaussienne
- Page 216 and 217:
216 8. Tests de copule gaussienne 1
- Page 218 and 219:
218 8. Tests de copule gaussienne
- Page 220 and 221:
220 8. Tests de copule gaussienne 1
- Page 222 and 223:
222 8. Tests de copule gaussienne
- Page 224 and 225:
224 8. Tests de copule gaussienne 9
- Page 226 and 227:
226 8. Tests de copule gaussienne 5
- Page 228 and 229:
228 8. Tests de copule gaussienne f
- Page 230 and 231:
230 8. Tests de copule gaussienne
- Page 232 and 233:
232 8. Tests de copule gaussienne
- Page 234 and 235:
234 8. Tests de copule gaussienne 6
- Page 236 and 237:
236 8. Tests de copule gaussienne T
- Page 238 and 239:
238 9. Mesure de la dépendance ext
- Page 240 and 241:
240 9. Mesure de la dépendance ext
- Page 242 and 243:
242 9. Mesure de la dépendance ext
- Page 244 and 245:
244 9. Mesure de la dépendance ext
- Page 246 and 247:
246 9. Mesure de la dépendance ext
- Page 248 and 249:
248 9. Mesure de la dépendance ext
- Page 250 and 251:
250 9. Mesure de la dépendance ext
- Page 252 and 253:
252 9. Mesure de la dépendance ext
- Page 254 and 255:
254 9. Mesure de la dépendance ext
- Page 256 and 257:
256 9. Mesure de la dépendance ext
- Page 258 and 259:
258 9. Mesure de la dépendance ext
- Page 260 and 261:
260 9. Mesure de la dépendance ext
- Page 262 and 263:
262 9. Mesure de la dépendance ext
- Page 264 and 265:
264 9. Mesure de la dépendance ext
- Page 266 and 267:
266 9. Mesure de la dépendance ext
- Page 268 and 269:
268 9. Mesure de la dépendance ext
- Page 270 and 271:
270 9. Mesure de la dépendance ext
- Page 272 and 273:
272 9. Mesure de la dépendance ext
- Page 274 and 275:
274 9. Mesure de la dépendance ext
- Page 276 and 277:
276 9. Mesure de la dépendance ext
- Page 278 and 279:
278 9. Mesure de la dépendance ext
- Page 280 and 281:
280 9. Mesure de la dépendance ext
- Page 282 and 283:
282 9. Mesure de la dépendance ext
- Page 284 and 285:
284 9. Mesure de la dépendance ext
- Page 286 and 287:
286 9. Mesure de la dépendance ext
- Page 288 and 289:
288 9. Mesure de la dépendance ext
- Page 290 and 291:
290 9. Mesure de la dépendance ext
- Page 292 and 293:
292 9. Mesure de la dépendance ext
- Page 294 and 295:
294 9. Mesure de la dépendance ext
- Page 296 and 297:
296 9. Mesure de la dépendance ext
- Page 298 and 299:
298 9. Mesure de la dépendance ext
- Page 300 and 301:
300 9. Mesure de la dépendance ext
- Page 302 and 303:
302 9. Mesure de la dépendance ext
- Page 304 and 305:
304 9. Mesure de la dépendance ext
- Page 306 and 307:
306 9. Mesure de la dépendance ext
- Page 308 and 309:
308 9. Mesure de la dépendance ext
- Page 310 and 311:
310 9. Mesure de la dépendance ext
- Page 312 and 313:
312 9. Mesure de la dépendance ext
- Page 314 and 315:
314 9. Mesure de la dépendance ext
- Page 316 and 317:
316 9. Mesure de la dépendance ext
- Page 318 and 319:
318 9. Mesure de la dépendance ext
- Page 320 and 321:
320 9. Mesure de la dépendance ext
- Page 322 and 323:
322 9. Mesure de la dépendance ext
- Page 324 and 325:
324 9. Mesure de la dépendance ext
- Page 326 and 327:
326 9. Mesure de la dépendance ext
- Page 328 and 329:
328 9. Mesure de la dépendance ext
- Page 330 and 331:
330 9. Mesure de la dépendance ext
- Page 332 and 333:
332 9. Mesure de la dépendance ext
- Page 334 and 335:
334 9. Mesure de la dépendance ext
- Page 336 and 337:
336 9. Mesure de la dépendance ext
- Page 338 and 339:
338 9. Mesure de la dépendance ext
- Page 340 and 341:
340 9. Mesure de la dépendance ext
- Page 342 and 343:
342 9. Mesure de la dépendance ext
- Page 345 and 346:
Chapitre 10 La mesure du risque Dan
- Page 347 and 348:
10.1. La théorie de l’utilité 3
- Page 349 and 350:
10.1. La théorie de l’utilité 3
- Page 351 and 352:
10.1. La théorie de l’utilité 3
- Page 353 and 354:
10.2. Les mesures de risque cohére
- Page 355 and 356:
10.2. Les mesures de risque cohére
- Page 357 and 358:
10.2. Les mesures de risque cohére
- Page 359 and 360:
10.3. Les mesures de fluctuations 3
- Page 361 and 362:
10.4. Conclusion 361 et de manière
- Page 363 and 364:
Chapitre 11 Portefeuilles optimaux
- Page 365 and 366:
11.2. Prise en compte des grands ri
- Page 367 and 368:
11.3. Equilibre de marché 367 s’
- Page 369 and 370:
11.5. Annexe 369 Collective Origin
- Page 371 and 372:
11.5. Annexe 371 point λ = 1. Thus
- Page 373 and 374:
Chapitre 12 Gestion des risques gra
- Page 375 and 376:
12.1. Comprendre et gérer les risq
- Page 377 and 378:
12.1. Comprendre et gérer les risq
- Page 379 and 380:
12.1. Comprendre et gérer les risq
- Page 381 and 382:
12.2. Minimiser l’impact des gran
- Page 383 and 384:
12.2. Minimiser l’impact des gran
- Page 385 and 386:
12.2. Minimiser l’impact des gran
- Page 387 and 388:
Chapitre 13 Gestion de portefeuille
- Page 389 and 390:
VaR-Efficient Portfolios for a Clas
- Page 391 and 392:
dependence: from independence to co
- Page 393 and 394:
given a series of return {rt}t foll
- Page 395 and 396:
eads cV (u1, · · · , un) = 1
- Page 397 and 398:
THEOREM 4 (TAIL EQUIVALENCE FOR A S
- Page 399 and 400:
Independent Assets Comonotonic Asse
- Page 401 and 402:
3.2 Typical recurrence time of larg
- Page 403 and 404:
and finally w ∗ i = χ−1 i j
- Page 405 and 406:
where the ˆwi’s are solution of
- Page 407 and 408:
Choosing x > y > Aɛ, and applying
- Page 409 and 410:
Expanding fi(xi) around x ∗ i yie
- Page 411 and 412:
for all h ∈ AC. Thus, integrating
- Page 413 and 414:
B Asymptotic distribution of the su
- Page 415 and 416:
This yields × h+ Sc−2 − 2 dh
- Page 417 and 418:
References Acerbi, A. and D. Tasche
- Page 419 and 420:
Malevergne, Y. and D. Sornette, 200
- Page 421 and 422:
ln(T/T 0 ) T Figure 2: Logarithm
- Page 423 and 424:
Chapitre 14 Gestion de Portefeuille
- Page 425 and 426:
Multi-Moments Method for Portfolio
- Page 427 and 428:
choosen risk measure. Section 5 pre
- Page 429 and 430:
The variance of the return X of an
- Page 431 and 432:
This property is verified for all c
- Page 433 and 434:
µn=α of order n = 2, 4, 6 and 8.
- Page 435 and 436:
these two assets or portfolios. The
- Page 437 and 438:
Due to the homogeneity property of
- Page 439 and 440:
invested in the risky fund depends
- Page 441 and 442:
C. Then, if g1(X1), · · · , gn(X
- Page 443 and 444:
Differentiating with respect to x1,
- Page 445 and 446:
7.2 Transformation of the modified
- Page 447 and 448:
In the sequel, we will first evalua
- Page 449 and 450:
8.3 Non-symmetric assets In the cas
- Page 451 and 452:
y the variance will then increase).
- Page 453 and 454:
A Description of the data set We ha
- Page 455 and 456:
thus and finally 1 λ1 n−1 = w
- Page 457 and 458:
C Composition of the market portfol
- Page 459 and 460:
D Generalized capital asset princin
- Page 461 and 462:
This brings us back to the problem
- Page 463 and 464:
F.2 General case We now consider a
- Page 465 and 466:
Harvey, C.R. and A. Siddique, 2000,
- Page 467 and 468:
µ µ2 1/2 µ4 1/4 µ6 1/6 µ8 1/8
- Page 469 and 470:
Mean (10 −3 ) Variance (10 −3 )
- Page 471 and 472:
μ (daily return) x 10−3 2.5 2 1.
- Page 473 and 474:
w i w i 0.2 0.15 0.1 0.05 Mean−μ
- Page 475 and 476:
Figure 6: Schematic representation
- Page 477 and 478:
Empirical Cumulative Distribution 1
- Page 479 and 480:
Z 2 1 0.9 0.8 0.7 0.6 0.5 0.4 0.3 0
- Page 481 and 482:
Z 2 1 0.9 0.8 0.7 0.6 0.5 0.4 0.3 0
- Page 483 and 484:
10 0 10 −1 10 0 10 −1 10 −1 1
- Page 485 and 486:
10 0 10 −1 10 0 10 −1 10 −1 1
- Page 487 and 488:
κ 22 20 18 16 14 12 10 8 6 4 2 Exc
- Page 489 and 490:
Return μ 0.12 0.11 0.1 0.09 0.08 0
- Page 491 and 492:
Conclusions et Perspectives L’obj
- Page 493 and 494:
Conclusion 493 en univers gaussien
- Page 495 and 496:
Annexe A Evaluation de la conduite
- Page 497 and 498:
A.2. Eléments de contexte 497 bora
- Page 499 and 500:
A.4. Compétences acquises et ensei
- Page 501 and 502:
A.5. Conclusion 501 de la recherche
- Page 503 and 504:
Bibliographie ACERBI, C. (2002) :
- Page 505 and 506:
Bibliographie 505 BOUCHAUD, J. P. E
- Page 507 and 508:
Bibliographie 507 DE FINETTI, B. (1
- Page 509 and 510:
Bibliographie 509 GRANGER, C. W. ET
- Page 511 and 512:
Bibliographie 511 LILLO, F. ET R. N
- Page 513 and 514:
Bibliographie 513 PATTON, A. (2001)
- Page 515:
Bibliographie 515 SUSMEL, R. (1996)