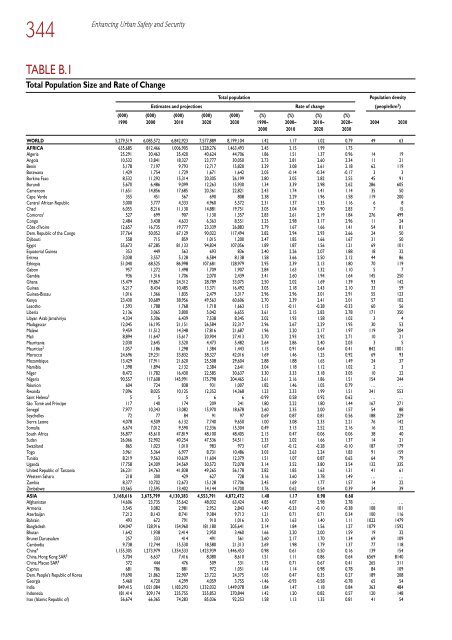
344Enhancing Urban Safety and SecurityTABLE B.1Total Population Size and Rate <strong>of</strong> ChangeTotal populationPopulation densityEstimates and projections Rate <strong>of</strong> change (people/km 2 )(000) (000) (000) (000) (000) (%) (%) (%) (%)1990 2000 2010 2020 2030 1990– 2000– 2010– 2020– 2004 20302000 2010 2020 2030WORLD 5,279,519 6,085,572 6,842,923 7,577,889 8,199,104 1.42 1.17 1.02 0.79 49 63AFRICA 635,685 812,466 1,006,905 1,228,276 1,463,493 2.45 2.15 1.99 1.75Algeria 25,291 30,463 35,420 40,624 44,706 1.86 1.51 1.37 0.96 14 19Angola 10,532 13,841 18,327 23,777 30,050 2.73 2.81 2.60 2.34 11 21Benin 5,178 7,197 9,793 12,717 15,820 3.29 3.08 2.61 2.18 62 119Botswana 1,429 1,754 1,729 1,671 1,642 2.05 -0.14 -0.34 -0.17 3 3Burkina Faso 8,532 11,292 15,314 20,305 26,199 2.80 3.05 2.82 2.55 45 91Burundi 5,670 6,486 9,099 12,263 15,930 1.34 3.39 2.98 2.62 286 605Cameroon 11,651 14,856 17,685 20,361 22,821 2.43 1.74 1.41 1.14 35 50Cape Verde 355 451 567 690 808 2.38 2.29 1.96 1.58 119 200Central African Republic 3,000 3,777 4,333 4,960 5,572 2.31 1.37 1.35 1.16 6 8Chad 6,055 8,216 11,130 14,881 19,751 3.05 3.04 2.90 2.83 7 15Comoros 1 527 699 907 1,130 1,357 2.83 2.61 2.19 1.84 276 499Congo 2,484 3,438 4,633 6,363 8,551 3.25 2.98 3.17 2.96 11 24Côte d’Ivoire 12,657 16,735 19,777 23,339 26,883 2.79 1.67 1.66 1.41 54 81Dem. Republic <strong>of</strong> <strong>the</strong> Congo 37,764 50,052 67,129 90,022 117,494 2.82 2.94 2.93 2.66 24 50Djibouti 558 715 859 1,015 1,200 2.47 1.85 1.66 1.67 31 50Egypt 55,673 67,285 81,133 94,834 107,056 1.89 1.87 1.56 1.21 69 101Equatorial Guinea 353 449 563 693 836 2.40 2.26 2.07 1.88 18 32Eritrea 3,038 3,557 5,128 6,584 8,138 1.58 3.66 2.50 2.12 44 86Ethiopia 51,040 68,525 86,998 107,681 128,979 2.95 2.39 2.13 1.80 70 119Gabon 957 1,272 1,498 1,709 1,907 2.84 1.63 1.32 1.10 5 7Gambia 936 1,316 1,706 2,070 2,439 3.41 2.60 1.94 1.64 145 250Ghana 15,479 19,867 24,312 28,789 33,075 2.50 2.02 1.69 1.39 93 142Guinea 6,217 8,434 10,485 13,371 16,492 3.05 2.18 2.43 2.10 33 59Guinea-Bissau 1,016 1,366 1,835 2,479 3,317 2.96 2.96 3.01 2.91 55 123Kenya 23,430 30,689 38,956 49,563 60,606 2.70 2.39 2.41 2.01 57 102Lesotho 1,593 1,788 1,768 1,718 1,663 1.15 -0.11 -0.28 -0.33 60 56Liberia 2,136 3,065 3,800 5,042 6,655 3.61 2.15 2.83 2.78 171 350Libyan Arab Jamahiriya 4,334 5,306 6,439 7,538 8,345 2.02 1.93 1.58 1.02 3 4Madagascar 12,045 16,195 21,151 26,584 32,317 2.96 2.67 2.29 1.95 30 53Malawi 9,459 11,512 14,348 17,816 21,687 1.96 2.20 2.17 1.97 119 204Mali 8,894 11,647 15,617 20,904 27,413 2.70 2.93 2.92 2.71 10 21Mauritania 2,030 2,645 3,520 4,473 5,482 2.64 2.86 2.40 2.03 3 5Mauritius 2 1,057 1,186 1,298 1,384 1,443 1.15 0.91 0.64 0.41 842 1001Morocco 24,696 29,231 33,832 38,327 42,016 1.69 1.46 1.25 0.92 69 93Mozambique 13,429 17,911 21,620 25,508 29,604 2.88 1.88 1.65 1.49 24 37Namibia 1,398 1,894 2,132 2,384 2,641 3.04 1.18 1.12 1.02 2 3Niger 8,472 11,782 16,430 22,585 30,637 3.30 3.33 3.18 3.05 10 22Nigeria 90,557 117,608 145,991 175,798 204,465 2.61 2.16 1.86 1.51 154 244Réunion 604 724 838 931 1,007 1.82 1.46 1.05 0.79 … …Rwanda 7,096 8,025 10,125 12,352 14,368 1.23 2.33 1.99 1.51 341 553Saint Helena 3 5 5 5 6 6 -0.99 0.58 0.92 0.62 … …São Tomé and Príncipe 117 140 174 209 241 1.80 2.22 1.80 1.44 167 271Senegal 7,977 10,343 13,082 15,970 18,678 2.60 2.35 2.00 1.57 54 88Seychelles 72 77 84 91 97 0.69 0.87 0.81 0.56 188 229Sierra Leone 4,078 4,509 6,132 7,740 9,650 1.00 3.08 2.33 2.21 76 142Somalia 6,674 7,012 9,590 12,336 15,304 0.49 3.13 2.52 2.16 16 32South Africa 36,877 45,610 47,819 48,100 48,405 2.13 0.47 0.06 0.06 38 40Sudan 26,066 32,902 40,254 47,536 54,511 2.33 2.02 1.66 1.37 14 21Swaziland 865 1,023 1,010 983 973 1.67 -0.12 -0.28 -0.10 187 179Togo 3,961 5,364 6,977 8,731 10,486 3.03 2.63 2.24 1.83 91 159Tunisia 8,219 9,563 10,639 11,604 12,379 1.51 1.07 0.87 0.65 64 79Uganda 17,758 24,309 34,569 50,572 72,078 3.14 3.52 3.80 3.54 132 335<strong>United</strong> Republic <strong>of</strong> Tanzania 26,231 34,763 41,838 49,265 56,178 2.82 1.85 1.63 1.31 41 61Western Sahara 218 300 429 627 728 3.16 3.60 3.78 1.49 … …Zambia 8,377 10,702 12,673 15,128 17,706 2.45 1.69 1.77 1.57 14 22Zimbabwe 10,565 12,595 13,402 14,144 14,700 1.76 0.62 0.54 0.39 34 39ASIA 3,168,616 3,675,799 4,130,383 4,553,791 4,872,472 1.48 1.17 0.98 0.68Afghanistan 14,606 23,735 35,642 48,032 63,424 4.85 4.07 2.98 2.78 … …Armenia 3,545 3,082 2,981 2,952 2,843 -1.40 -0.33 -0.10 -0.38 108 101Azerbaijan 7,212 8,143 8,741 9,384 9,713 1.21 0.71 0.71 0.34 100 116Bahrain 493 672 791 910 1,016 3.10 1.63 1.40 1.11 1022 1479Bangladesh 104,047 128,916 154,960 181,180 205,641 2.14 1.84 1.56 1.27 1079 1592Bhutan 1,642 1,938 2,414 2,950 3,460 1.66 2.20 2.00 1.59 19 32Brunei Darussalam 257 333 414 491 561 2.60 2.17 1.70 1.34 69 109Cambodia 9,738 12,744 15,530 18,580 21,313 2.69 1.98 1.79 1.37 77 118China 4 1,155,305 1,273,979 1,354,533 1,423,939 1,446,453 0.98 0.61 0.50 0.16 139 154China, Hong Kong SAR 5 5,704 6,637 7,416 8,080 8,610 1.51 1.11 0.86 0.64 6569 8140China, Macao SAR 6 372 444 476 509 531 1.75 0.71 0.67 0.41 265 311Cyprus 681 786 881 972 1,051 1.44 1.14 0.98 0.78 84 109Dem. People’s Republic <strong>of</strong> Korea 19,690 21,862 22,907 23,722 24,375 1.05 0.47 0.35 0.27 189 208Georgia 5,460 4,720 4,299 4,059 3,755 -1.46 -0.93 -0.58 -0.78 65 54India 849,415 1,021,084 1,183,293 1,332,032 1,449,078 1.84 1.47 1.18 0.84 363 484Indonesia 181,414 209,174 235,755 255,853 270,844 1.42 1.20 0.82 0.57 120 148Iran (Islamic Republic <strong>of</strong>) 56,674 66,365 74,283 85,036 92,253 1.58 1.13 1.35 0.81 41 54
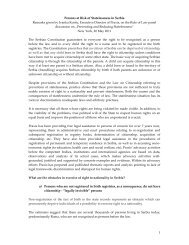
Data tables345TABLE B.1continuedTotal populationPopulation densityEstimates and projections Rate <strong>of</strong> change (people/km 2 )(000) (000) (000) (000) (000) (%) (%) (%) (%)1990 2000 2010 2020 2030 1990– 2000– 2010– 2020– 2004 20302000 2010 2020 2030Iraq 18,515 25,075 32,534 40,522 48,797 3.03 2.60 2.20 1.86 58 105Israel 4,514 6,084 7,315 8,296 9,156 2.99 1.84 1.26 0.99 313 436Japan 123,537 127,034 128,457 126,713 122,566 0.28 0.11 -0.14 -0.33 351 337Jordan 3,254 4,972 6,338 7,556 8,672 4.24 2.43 1.76 1.38 61 96Kazakhstan 16,500 15,033 14,802 14,883 14,556 -0.93 -0.16 0.05 -0.22 6 6Kuwait 2,143 2,230 3,047 3,698 4,296 0.40 3.12 1.94 1.50 138 232Kyrgyzstan 4,395 4,952 5,567 6,094 6,431 1.19 1.17 0.90 0.54 27 33Lao People’s Dem. Republic 4,132 5,279 6,604 8,014 9,389 2.45 2.24 1.94 1.58 25 40Lebanon 2,741 3,398 3,773 4,140 4,428 2.15 1.05 0.93 0.67 445 555Malaysia 17,845 22,997 27,532 31,474 34,720 2.54 1.80 1.34 0.98 77 108Maldives 216 290 371 461 547 2.97 2.47 2.17 1.70 998 1759Mongolia 2,216 2,497 2,813 3,137 3,381 1.19 1.19 1.09 0.75 2 3Myanmar 40,753 47,724 52,801 57,054 60,629 1.58 1.01 0.77 0.61 76 94Nepal 19,114 24,431 29,891 35,679 41,424 2.45 2.02 1.77 1.49 176 274Occupied Palestinian Territory 2,154 3,150 4,330 5,694 7,171 3.80 3.18 2.74 2.31 564 1117Oman 1,843 2,442 2,863 3,481 4,053 2.81 1.59 1.96 1.52 9 14Pakistan 111,698 142,648 175,178 211,703 246,322 2.45 2.05 1.89 1.51 197 312Philippines 61,104 75,766 90,048 103,266 114,080 2.15 1.73 1.37 1.00 278 389Qatar 467 606 894 1,036 1,158 2.60 3.88 1.47 1.11 58 99Republic <strong>of</strong> Korea 42,869 46,779 48,566 49,393 49,161 0.87 0.37 0.17 -0.05 488 505Saudi Arabia 16,379 21,484 27,664 34,024 40,132 2.71 2.53 2.07 1.65 11 18Singapore 3,016 4,017 4,590 4,986 5,265 2.87 1.33 0.83 0.55 6470 8022Sri Lanka 17,786 19,848 21,557 22,902 23,667 1.10 0.83 0.61 0.33 301 347Syrian Arab Republic 12,843 16,813 21,432 26,029 29,983 2.69 2.43 1.94 1.41 97 156Tajikistan 5,303 6,159 6,992 8,216 9,237 1.50 1.27 1.61 1.17 46 65Thailand 54,639 61,438 66,785 71,044 73,827 1.17 0.83 0.62 0.38 122 142Timor-Leste 740 722 1,244 1,713 2,173 -0.25 5.44 3.20 2.38 62 158Turkey 57,300 68,234 78,081 86,774 93,876 1.75 1.35 1.06 0.79 93 121Turkmenistan 3,668 4,502 5,163 5,811 6,270 2.05 1.37 1.18 0.76 10 13<strong>United</strong> Arab Emirates 1,868 3,247 5,035 6,144 7,225 5.53 4.39 1.99 1.62 51 100Uzbekistan 20,515 24,724 28,578 32,515 35,329 1.87 1.45 1.29 0.83 63 85Viet Nam 66,206 78,671 89,718 99,928 108,128 1.73 1.31 1.08 0.79 252 328Yemen 12,086 17,937 24,502 32,733 41,499 3.95 3.12 2.90 2.37 37 75EUROPE 721,390 728,463 725,786 714,959 698,140 0.10 -0.04 -0.15 -0.24Albania 3,289 3,062 3,216 3,420 3,512 -0.72 0.49 0.61 0.27 116 130Andorra 52 66 68 67 66 2.31 0.26 -0.09 -0.24 136 134Austria 7,729 8,096 8,248 8,320 8,333 0.46 0.19 0.09 0.01 98 100Belarus 10,266 10,029 9,484 8,939 8,314 -0.23 -0.56 -0.59 -0.73 47 40Belgium 9,967 10,304 10,495 10,573 10,588 0.33 0.18 0.07 0.01 344 351Bosnia and Herzegovina 4,308 3,847 3,935 3,827 3,639 -1.13 0.23 -0.28 -0.50 75 70Bulgaria 8,718 7,997 7,446 6,859 6,243 -0.86 -0.71 -0.82 -0.94 70 56Channel Islands 7 142 147 152 158 164 0.33 0.36 0.36 0.37 745 823Croatia 4,517 4,505 4,532 4,367 4,164 -0.03 0.06 -0.37 -0.48 81 75Czech Republic 10,306 10,267 10,158 9,932 9,525 -0.04 -0.11 -0.23 -0.42 132 123Denmark 5,140 5,340 5,502 5,624 5,752 0.38 0.30 0.22 0.23 127 135Estonia 1,584 1,367 1,309 1,272 1,221 -1.47 -0.43 -0.29 -0.41 32 29Faeroe Islands 47 46 49 51 54 -0.39 0.62 0.60 0.39 34 39Finland 8 4,986 5,177 5,307 5,409 5,453 0.37 0.25 0.19 0.08 17 18France 56,735 59,278 61,535 62,954 63,712 0.44 0.37 0.23 0.12 109 115Germany 79,433 82,344 82,701 82,283 81,512 0.36 0.04 -0.05 -0.09 237 234Gibraltar 27 28 28 28 28 0.30 0.13 0.03 -0.09 … …Greece 10,160 10,975 11,205 11,217 11,119 0.77 0.21 0.01 -0.09 86 86Holy See 9 1 1 1 1 1 0.22 -0.03 0.00 -0.26 … …Hungary 10,365 10,226 9,961 9,628 9,221 -0.14 -0.26 -0.34 -0.43 109 99Iceland 255 281 307 330 349 0.99 0.88 0.71 0.58 125 152Ireland 3,515 3,801 4,422 4,893 5,249 0.78 1.51 1.01 0.70 58 75Isle <strong>of</strong> Man 70 77 76 75 74 0.89 -0.07 -0.10 -0.16 135 131Italy 56,719 57,715 58,176 57,132 55,423 0.17 0.08 -0.18 -0.30 196 188Latvia 2,713 2,373 2,248 2,129 1,981 -1.34 -0.54 -0.54 -0.72 37 32Liechtenstein 29 33 36 39 41 1.25 0.92 0.73 0.61 213 260Lithuania 3,698 3,500 3,358 3,214 3,029 -0.55 -0.41 -0.44 -0.59 55 48Luxembourg 378 435 494 552 612 1.42 1.27 1.11 1.04 174 236Malta 360 392 411 426 434 0.84 0.47 0.37 0.18 400 437Monaco 30 33 37 42 46 1.02 1.12 1.14 1.01 159 214Ne<strong>the</strong>rlands 14,952 15,898 16,592 17,007 17,303 0.61 0.43 0.25 0.17 480 513Norway 10 4,241 4,502 4,730 4,960 5,190 0.60 0.49 0.47 0.45 15 17Poland 38,111 38,649 38,359 37,712 36,254 0.14 -0.08 -0.17 -0.39 125 118Portugal 9,983 10,225 10,712 10,902 10,933 0.24 0.47 0.18 0.03 114 120Republic <strong>of</strong> Moldova 4,364 4,275 4,160 4,054 3,856 -0.21 -0.27 -0.26 -0.50 128 117Romania 23,207 22,117 21,287 20,396 19,285 -0.48 -0.38 -0.43 -0.56 95 84Russian Federation 148,370 146,560 140,028 133,101 125,325 -0.12 -0.46 -0.51 -0.60 8 7San Marino 24 27 29 30 31 1.09 0.79 0.35 0.13 463 515Serbia and Montenegro 10,156 10,545 10,478 10,335 10,114 0.38 -0.06 -0.14 -0.22 80 77Slovakia 5,256 5,400 5,400 5,350 5,189 0.27 -0.00 -0.09 -0.31 110 106Slovenia 1,926 1,967 1,959 1,917 1,842 0.21 -0.04 -0.22 -0.40 99 93Spain 39,303 40,717 43,993 44,419 44,008 0.35 0.77 0.10 -0.09 83 87Sweden 8,559 8,877 9,168 9,488 9,769 0.37 0.32 0.34 0.29 22 24
- Page 3:
ENHANCING URBAN SAFETYAND SECURITY
- Page 6 and 7:
First published by Earthscan in the
- Page 8 and 9:
INTRODUCTIONEnhancing Urban Safety
- Page 10 and 11:
ACKNOWLEDGEMENTSThe preparation of
- Page 12 and 13:
xEnhancing Urban Safety and Securit
- Page 14 and 15:
xiiEnhancing Urban Safety and Secur
- Page 16 and 17:
xivEnhancing Urban Safety and Secur
- Page 18 and 19:
xviEnhancing Urban Safety and Secur
- Page 20 and 21:
xviiiEnhancing Urban Safety and Sec
- Page 22 and 23:
LIST OF FIGURES, BOXES ANDTABLESFIG
- Page 24 and 25:
xxiiEnhancing Urban Safety and Secu
- Page 26 and 27:
xxivEnhancing Urban Safety and Secu
- Page 28 and 29:
xxviEnhancing Urban Safety and Secu
- Page 30 and 31:
xxviiiEnhancing Urban Safety and Se
- Page 32 and 33:
xxxEnhancing Urban Safety and Secur
- Page 34:
xxxiiEnhancing Urban Safety and Sec
- Page 38 and 39:
4Understanding Urban Safety and Sec
- Page 41 and 42:
1CHAPTERCURRENT THREATS TO URBANSAF
- Page 43 and 44:
Current threats to urban safety and
- Page 45 and 46:
Current threats to urban safety and
- Page 47 and 48:
Current threats to urban safety and
- Page 49 and 50:
Current threats to urban safety and
- Page 51 and 52:
Current threats to urban safety and
- Page 53 and 54:
Current threats to urban safety and
- Page 55 and 56:
Current threats to urban safety and
- Page 57 and 58:
2CHAPTERVULNERABILITY, RISK ANDRESI
- Page 59 and 60:
Vulnerability, risk and resilience:
- Page 61 and 62:
Vulnerability, risk and resilience:
- Page 63 and 64:
Vulnerability, risk and resilience:
- Page 65 and 66:
Vulnerability, risk and resilience:
- Page 67 and 68:
Vulnerability, risk and resilience:
- Page 69 and 70:
Vulnerability, risk and resilience:
- Page 71 and 72:
Vulnerability, risk and resilience:
- Page 73 and 74:
Vulnerability, risk and resilience:
- Page 75:
Vulnerability, risk and resilience:
- Page 80 and 81:
46Urban crime and violenceBox II.1
- Page 82 and 83:
48Urban crime and violenceit has mu
- Page 84 and 85:
50Urban crime and violenceFormal an
- Page 86 and 87:
52Urban crime and violenceContact c
- Page 88 and 89:
54Urban crime and violencePer 100,0
- Page 90 and 91:
56Urban crime and violenceBurglary
- Page 92 and 93:
58Urban crime and violencePercentag
- Page 94 and 95:
60Urban crime and violenceFigure 3.
- Page 96 and 97:
62Urban crime and violenceTable 3.3
- Page 98 and 99:
64Urban crime and violenceYouth gan
- Page 100 and 101:
66Urban crime and violenceTable 3.4
- Page 102 and 103:
68Urban crime and violenceType of v
- Page 104 and 105:
70Urban crime and violenceFrom a pl
- Page 106 and 107:
72Urban crime and violenceOne viole
- Page 108 and 109:
74Urban crime and violenceHigh homi
- Page 110 and 111:
76Urban crime and violenceAbused ch
- Page 112 and 113:
78Urban crime and violenceGenerally
- Page 114 and 115:
80Urban crime and violenceTable 3.6
- Page 116 and 117:
82Urban crime and violenceporate cr
- Page 118 and 119:
4CHAPTERURBAN CRIME AND VIOLENCE:PO
- Page 120 and 121:
86Urban crime and violenceUN-Habita
- Page 122 and 123:
88Urban crime and violenceBox 4.2 T
- Page 124 and 125:
90Urban crime and violenceBox 4.4 T
- Page 126 and 127:
92Urban crime and violenceLegislati
- Page 128 and 129:
94Urban crime and violenceabove wha
- Page 130 and 131:
96Urban crime and violenceCampaigns
- Page 132 and 133:
98Urban crime and violenceAvailable
- Page 134 and 135:
100Urban crime and violenceBox 4.7
- Page 136 and 137:
102Urban crime and violenceIn some
- Page 138 and 139:
104Urban crime and violenceInitiati
- Page 140 and 141:
106Urban crime and violenceThe most
- Page 142:
108Urban crime and violenceVandersc
- Page 146 and 147:
112Security of tenureBox III.1 Secu
- Page 148 and 149:
5CHAPTERSECURITY OF TENURE:CONDITIO
- Page 150 and 151:
116Security of tenureTable 5.1A gen
- Page 152 and 153:
118Security of tenureFully legalDeg
- Page 154 and 155:
120Security of tenureBox 5.4 Securi
- Page 156 and 157:
122Security of tenureUrban tenurein
- Page 158 and 159:
124Security of tenureAt least 2 mil
- Page 160 and 161:
126Security of tenureMarket-basedev
- Page 162 and 163:
128Security of tenureBox 5.11 Urban
- Page 164 and 165:
130Security of tenureOperationMuram
- Page 166 and 167:
132Security of tenureControl of lan
- Page 168 and 169:
134Security of tenureBox 5.18 Secur
- Page 170 and 171:
136Security of tenureNOTES1 Habitat
- Page 172 and 173:
138Security of tenureBox 6.1 The Mi
- Page 174 and 175:
140Security of tenureIt would be fo
- Page 176 and 177:
142Security of tenureBox 6.7 Land t
- Page 178 and 179:
144Security of tenureBox 6.10 What
- Page 180 and 181:
146Security of tenureBox 6.12 Evict
- Page 182 and 183:
148Security of tenureBox 6.15 Const
- Page 184 and 185:
150Security of tenureBox 6.18 Viola
- Page 186 and 187:
152Security of tenureThe GlobalCamp
- Page 188 and 189:
154Security of tenureBox 6.24 Land-
- Page 190 and 191:
156Security of tenureThe state is o
- Page 192 and 193:
158Security of tenureHousing rights
- Page 197 and 198:
Over the last three decades, natura
- Page 199 and 200:
Introduction165One of the key trend
- Page 201 and 202:
7CHAPTERDISASTER RISK: CONDITIONS,T
- Page 203 and 204:
Disaster risk: Conditions, trends a
- Page 205 and 206:
Disaster risk: Conditions, trends a
- Page 207 and 208:
Disaster risk: Conditions, trends a
- Page 209 and 210:
Disaster risk: Conditions, trends a
- Page 211 and 212:
Disaster risk: Conditions, trends a
- Page 213 and 214:
Disaster risk: Conditions, trends a
- Page 215 and 216:
Disaster risk: Conditions, trends a
- Page 217 and 218:
Disaster risk: Conditions, trends a
- Page 219 and 220:
Disaster risk: Conditions, trends a
- Page 221 and 222:
Disaster risk: Conditions, trends a
- Page 223 and 224:
Disaster risk: Conditions, trends a
- Page 225 and 226:
Disaster risk: Conditions, trends a
- Page 227 and 228:
Disaster risk: Conditions, trends a
- Page 229 and 230:
8CHAPTERPOLICY RESPONSES TODISASTER
- Page 231 and 232:
Policy responses to disaster risk19
- Page 233 and 234:
Policy responses to disaster risk19
- Page 235 and 236:
Policy responses to disaster risk20
- Page 237 and 238:
Policy responses to disaster risk20
- Page 239 and 240:
Policy responses to disaster risk20
- Page 241 and 242:
Policy responses to disaster risk20
- Page 243 and 244:
Policy responses to disaster risk20
- Page 245 and 246:
Policy responses to disaster risk21
- Page 247 and 248:
Policy responses to disaster risk21
- Page 249 and 250:
Policy responses to disaster risk21
- Page 251:
Policy responses to disaster risk21
- Page 254 and 255:
220Natural and human-made disasters
- Page 256 and 257:
222Natural and human-made disasters
- Page 258 and 259:
224Natural and human-made disasters
- Page 260 and 261:
226Natural and human-made disasters
- Page 262 and 263:
228Natural and human-made disasters
- Page 264 and 265:
230Natural and human-made disasters
- Page 266:
232Natural and human-made disasters
- Page 270 and 271:
236Towards safer and more secure ci
- Page 272 and 273:
238Towards safer and more secure ci
- Page 274 and 275:
240Towards safer and more secure ci
- Page 276 and 277:
242Towards safer and more secure ci
- Page 278 and 279:
244Towards safer and more secure ci
- Page 280 and 281:
246Towards safer and more secure ci
- Page 282 and 283:
248Towards safer and more secure ci
- Page 284 and 285:
250Towards safer and more secure ci
- Page 286 and 287:
252Towards safer and more secure ci
- Page 288 and 289:
254Towards safer and more secure ci
- Page 290 and 291:
256Towards safer and more secure ci
- Page 292 and 293:
258Towards safer and more secure ci
- Page 294 and 295:
260Towards safer and more secure ci
- Page 296 and 297:
11CHAPTERENHANCING TENURE SECURITYA
- Page 298 and 299:
264Towards safer and more secure ci
- Page 300 and 301:
266Towards safer and more secure ci
- Page 302 and 303:
268Towards safer and more secure ci
- Page 304 and 305:
270Towards safer and more secure ci
- Page 306 and 307:
272Towards safer and more secure ci
- Page 308 and 309:
274Towards safer and more secure ci
- Page 310 and 311:
276Enhancing Urban Safety and Secur
- Page 312 and 313:
12CHAPTERMITIGATING THE IMPACTS OFD
- Page 314 and 315:
280Towards safer and more secure ci
- Page 316 and 317:
282Towards safer and more secure ci
- Page 318 and 319:
284Towards safer and more secure ci
- Page 320 and 321:
286Towards safer and more secure ci
- Page 322 and 323:
288Towards safer and more secure ci
- Page 324 and 325:
290Towards safer and more secure ci
- Page 326 and 327:
292Towards safer and more secure ci
- Page 328 and 329: 294Towards safer and more secure ci
- Page 330 and 331: 296Towards safer and more secure ci
- Page 332 and 333: 298Towards safer and more secure ci
- Page 334: 300Towards safer and more secure ci
- Page 338 and 339: 304Summary of case studiesSince its
- Page 340 and 341: 306Summary of case studies• The e
- Page 342 and 343: 308Summary of case studiestions wit
- Page 344 and 345: 310Summary of case studiesenvironme
- Page 346 and 347: 312Summary of case studiesothers. O
- Page 348 and 349: 314Summary of case studiespurposes.
- Page 350 and 351: 316Summary of case studiesThese eff
- Page 352 and 353: 318Summary of case studiesdevelopme
- Page 354 and 355: 320Summary of case studiestion exer
- Page 356 and 357: 322Summary of case studiesHousing r
- Page 358 and 359: 324Summary of case studiesProlonged
- Page 360: 326Summary of case studiesmomentum
- Page 364 and 365: 330Statistical annexIslands, Micron
- Page 366 and 367: 332Statistical annexNOMENCLATURE AN
- Page 368 and 369: 334Statistical annexPopulation, urb
- Page 370 and 371: 336Statistical annexSOURCES OF DATA
- Page 372 and 373: 338Enhancing Urban Safety and Secur
- Page 374 and 375: 340Enhancing Urban Safety and Secur
- Page 376 and 377: 342Enhancing Urban Safety and Secur
- Page 380 and 381: 346Enhancing Urban Safety and Secur
- Page 382 and 383: 348Enhancing Urban Safety and Secur
- Page 384 and 385: 350Enhancing Urban Safety and Secur
- Page 386 and 387: 352Enhancing Urban Safety and Secur
- Page 388 and 389: 354Enhancing Urban Safety and Secur
- Page 390 and 391: 356Enhancing Urban Safety and Secur
- Page 392 and 393: 358Enhancing Urban Safety and Secur
- Page 394 and 395: 360Enhancing Urban Safety and Secur
- Page 396 and 397: 362Enhancing Urban Safety and Secur
- Page 398 and 399: 364Enhancing Urban Safety and Secur
- Page 400 and 401: 366Enhancing Urban Safety and Secur
- Page 402 and 403: 368Enhancing Urban Safety and Secur
- Page 404 and 405: 370Enhancing Urban Safety and Secur
- Page 406 and 407: 372Enhancing Urban Safety and Secur
- Page 408 and 409: 374Enhancing Urban Safety and Secur
- Page 410 and 411: 376Enhancing Urban Safety and Secur
- Page 412 and 413: 378Enhancing Urban Safety and Secur
- Page 414 and 415: 380Enhancing Urban Safety and Secur
- Page 416 and 417: 382Enhancing Urban Safety and Secur
- Page 418 and 419: 384Enhancing Urban Safety and Secur
- Page 420 and 421: 386Enhancing Urban Safety and Secur
- Page 422 and 423: 388Enhancing Urban Safety and Secur
- Page 424 and 425: 390Enhancing Urban Safety and Secur
- Page 426 and 427: 392Enhancing Urban Safety and Secur
- Page 428 and 429:
394Enhancing Urban Safety and Secur
- Page 430 and 431:
396Enhancing Urban Safety and Secur
- Page 432 and 433:
398Enhancing Urban Safety and Secur
- Page 434 and 435:
400Enhancing Urban Safety and Secur
- Page 436 and 437:
402Enhancing Urban Safety and Secur
- Page 438 and 439:
404Enhancing Urban Safety and Secur
- Page 440 and 441:
406Enhancing Urban Safety and Secur
- Page 442 and 443:
408Enhancing Urban Safety and Secur
- Page 444 and 445:
410TABLE C.7continuedEnhancing Urba
- Page 446 and 447:
412Enhancing Urban Safety and Secur
- Page 448 and 449:
414Enhancing Urban Safety and Secur
- Page 450 and 451:
416Enhancing Urban Safety and Secur
- Page 452 and 453:
418Enhancing Urban Safety and Secur
- Page 454 and 455:
420Enhancing Urban Safety and Secur
- Page 456 and 457:
422Enhancing Urban Safety and Secur
- Page 458 and 459:
424Enhancing Urban Safety and Secur
- Page 460 and 461:
426Enhancing Urban Safety and Secur
- Page 462 and 463:
428Enhancing Urban Safety and Secur
- Page 464 and 465:
430Enhancing Urban Safety and Secur
- Page 467 and 468:
INDEXACHR (Asian Coalition for Hous
- Page 469 and 470:
Index435security of tenure 134confl
- Page 471 and 472:
Index437domestic abuse see intimate
- Page 473 and 474:
Index439hazard management 169hazard
- Page 475 and 476:
Index441Kosovo, security of tenure
- Page 477 and 478:
Index443participation 38, 296-299pa
- Page 479 and 480:
Index445individual 34-35municipal f
- Page 481 and 482:
Index447gun ownership 78Homeless Pe