Download the file - United Nations Rule of Law
Download the file - United Nations Rule of Law
Download the file - United Nations Rule of Law
- No tags were found...

Create successful ePaper yourself
Turn your PDF publications into a flip-book with our unique Google optimized e-Paper software.
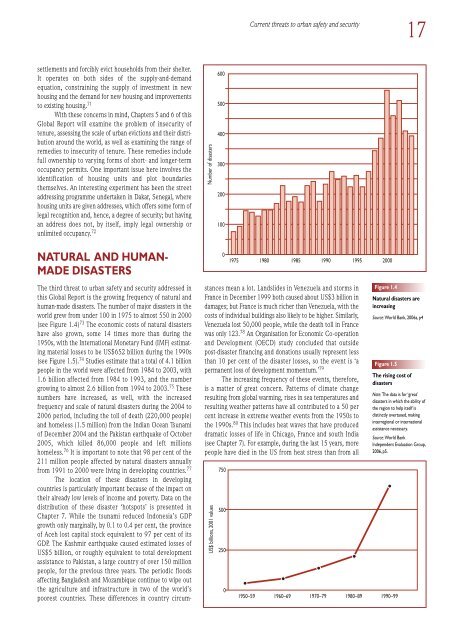
Current threats to urban safety and security17settlements and forcibly evict households from <strong>the</strong>ir shelter.It operates on both sides <strong>of</strong> <strong>the</strong> supply-and-demandequation, constraining <strong>the</strong> supply <strong>of</strong> investment in newhousing and <strong>the</strong> demand for new housing and improvementsto existing housing. 71With <strong>the</strong>se concerns in mind, Chapters 5 and 6 <strong>of</strong> thisGlobal Report will examine <strong>the</strong> problem <strong>of</strong> insecurity <strong>of</strong>tenure, assessing <strong>the</strong> scale <strong>of</strong> urban evictions and <strong>the</strong>ir distributionaround <strong>the</strong> world, as well as examining <strong>the</strong> range <strong>of</strong>remedies to insecurity <strong>of</strong> tenure. These remedies includefull ownership to varying forms <strong>of</strong> short- and longer-termoccupancy permits. One important issue here involves <strong>the</strong>identification <strong>of</strong> housing units and plot boundaries<strong>the</strong>mselves. An interesting experiment has been <strong>the</strong> streetaddressing programme undertaken in Dakar, Senegal, wherehousing units are given addresses, which <strong>of</strong>fers some form <strong>of</strong>legal recognition and, hence, a degree <strong>of</strong> security; but havingan address does not, by itself, imply legal ownership orunlimited occupancy. 72Number <strong>of</strong> disasters600500400300200100NATURAL AND HUMAN-MADE DISASTERS019751980 1985 1990 1995 2000The third threat to urban safety and security addressed inthis Global Report is <strong>the</strong> growing frequency <strong>of</strong> natural andhuman-made disasters. The number <strong>of</strong> major disasters in <strong>the</strong>world grew from under 100 in 1975 to almost 550 in 2000(see Figure 1.4) 73 The economic costs <strong>of</strong> natural disastershave also grown, some 14 times more than during <strong>the</strong>1950s, with <strong>the</strong> International Monetary Fund (IMF) estimatingmaterial losses to be US$652 billion during <strong>the</strong> 1990s(see Figure 1.5). 74 Studies estimate that a total <strong>of</strong> 4.1 billionpeople in <strong>the</strong> world were affected from 1984 to 2003, with1.6 billion affected from 1984 to 1993, and <strong>the</strong> numbergrowing to almost 2.6 billion from 1994 to 2003. 75 Thesenumbers have increased, as well, with <strong>the</strong> increasedfrequency and scale <strong>of</strong> natural disasters during <strong>the</strong> 2004 to2006 period, including <strong>the</strong> toll <strong>of</strong> death (220,000 people)and homeless (1.5 million) from <strong>the</strong> Indian Ocean Tsunami<strong>of</strong> December 2004 and <strong>the</strong> Pakistan earthquake <strong>of</strong> October2005, which killed 86,000 people and left millionshomeless. 76 It is important to note that 98 per cent <strong>of</strong> <strong>the</strong>211 million people affected by natural disasters annuallyfrom 1991 to 2000 were living in developing countries. 77The location <strong>of</strong> <strong>the</strong>se disasters in developingcountries is particularly important because <strong>of</strong> <strong>the</strong> impact on<strong>the</strong>ir already low levels <strong>of</strong> income and poverty. Data on <strong>the</strong>distribution <strong>of</strong> <strong>the</strong>se disaster ‘hotspots’ is presented inChapter 7. While <strong>the</strong> tsunami reduced Indonesia’s GDPgrowth only marginally, by 0.1 to 0.4 per cent, <strong>the</strong> province<strong>of</strong> Aceh lost capital stock equivalent to 97 per cent <strong>of</strong> itsGDP. The Kashmir earthquake caused estimated losses <strong>of</strong>US$5 billion, or roughly equivalent to total developmentassistance to Pakistan, a large country <strong>of</strong> over 150 millionpeople, for <strong>the</strong> previous three years. The periodic floodsaffecting Bangladesh and Mozambique continue to wipe out<strong>the</strong> agriculture and infrastructure in two <strong>of</strong> <strong>the</strong> world’spoorest countries. These differences in country circumstancesmean a lot. Landslides in Venezuela and storms inFrance in December 1999 both caused about US$3 billion indamages; but France is much richer than Venezuela, with <strong>the</strong>costs <strong>of</strong> individual buildings also likely to be higher. Similarly,Venezuela lost 50,000 people, while <strong>the</strong> death toll in Francewas only 123. 78 An Organisation for Economic Co-operationand Development (OECD) study concluded that outsidepost-disaster financing and donations usually represent lessthan 10 per cent <strong>of</strong> <strong>the</strong> disaster losses, so <strong>the</strong> event is ‘apermanent loss <strong>of</strong> development momentum.’ 79The increasing frequency <strong>of</strong> <strong>the</strong>se events, <strong>the</strong>refore,is a matter <strong>of</strong> great concern. Patterns <strong>of</strong> climate changeresulting from global warming, rises in sea temperatures andresulting wea<strong>the</strong>r patterns have all contributed to a 50 percent increase in extreme wea<strong>the</strong>r events from <strong>the</strong> 1950s to<strong>the</strong> 1990s. 80 This includes heat waves that have produceddramatic losses <strong>of</strong> life in Chicago, France and south India(see Chapter 7). For example, during <strong>the</strong> last 15 years, morepeople have died in <strong>the</strong> US from heat stress than from allUS$ billions, 2001 values75050025001950–59Figure 1.4Natural disasters areincreasingSource: World Bank, 2006a, p4Figure 1.5The rising cost <strong>of</strong>disasters1960–69 1970–79 1980–89 1990–99Note: The data is for ‘great’disasters in which <strong>the</strong> ability <strong>of</strong><strong>the</strong> region to help itself isdistinctly overtaxed, makinginterregional or internationalassistance necessary.Source: World BankIndependent Evaluation Group,2006, p5.