Download the file - United Nations Rule of Law
Download the file - United Nations Rule of Law
Download the file - United Nations Rule of Law
- No tags were found...
You also want an ePaper? Increase the reach of your titles
YUMPU automatically turns print PDFs into web optimized ePapers that Google loves.
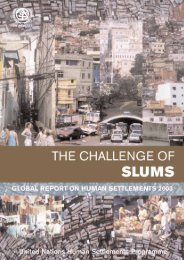
Urban crime and violence: Conditions and trends59CorruptionAlthough it comes in many forms, corruption is generallyclassified as a crime against public order. There is no universallyaccepted definition <strong>of</strong> corruption; but it has beensummarized as <strong>the</strong> abuse <strong>of</strong> public power for personalgain. 67 It constitutes a growing threat to human security andplays a significant role in urban development, planning,management, and programme design and policy. Corruptionmay be found at <strong>the</strong> ‘grand scale’, penetrating <strong>the</strong> highestpolicy-making organs <strong>of</strong> government, or it may be seen at‘petty’ or street-scale levels, which involve day-to-day publicand social transactions. It <strong>of</strong>ten involves soliciting, giving ortaking bribes and is sometimes categorized by levels <strong>of</strong> ‘infiltration’within <strong>the</strong> public sector. While grand corruption has<strong>the</strong> broadest impacts on societies, corruption in any formhelps to destroy public confidence in <strong>the</strong> fairness <strong>of</strong> government,<strong>the</strong> rule <strong>of</strong> law and economic stability. 68 There areseveral measures <strong>of</strong> corruption. Among <strong>the</strong> most widely usedare <strong>the</strong> Corruption Perceptions Index (CPI) and <strong>the</strong> GlobalCorruption Barometer (GCB), both developed byTransparency International. Each is discussed briefly below.■ The Corruption Perceptions Index (CPI)The Corruption Perceptions Index calculates a score on <strong>the</strong>perceived levels <strong>of</strong> corruption in a given country, based on<strong>the</strong> responses <strong>of</strong> business people and analysts around <strong>the</strong>world, including local experts resident in <strong>the</strong> country beingevaluated. The CPI has a range <strong>of</strong> between 10 (highly clean)and 0 (highly corrupt). A higher score means less perceivedcorruption. The map in Figure 3.13 shows <strong>the</strong> ranking for158 countries. It indicates that <strong>the</strong> top ten ranked countries(least corrupt countries) are wealthy European and Oceanicnations, headed by Iceland. The bottom ten ranked countriesconsist largely <strong>of</strong> poor and developing nations <strong>of</strong> EasternEurope, Asia, Africa and <strong>the</strong> Caribbean, with Bangladesh andChad being <strong>the</strong> lowest ranked. 71■ The Global Corruption Barometer (GCB)The Global Corruption Barometer provides an indication <strong>of</strong><strong>the</strong> extent and nature <strong>of</strong> corruption from <strong>the</strong> perspective <strong>of</strong>ordinary people or <strong>the</strong> general public around <strong>the</strong> world.Findings from <strong>the</strong> 2005 GCB based on a survey <strong>of</strong> 54,260people in 69 countries noted that political parties, parliaments,<strong>the</strong> police and <strong>the</strong> judicial system were <strong>the</strong> mostcorrupt. 70 Figure 3.14 illustrates <strong>the</strong> distribution <strong>of</strong>responses among sectors in this regard. Religious bodies,non-governmental organizations (NGOs) and registry andpermit services are considered <strong>the</strong> least corrupt sectors.Although <strong>the</strong> responses vary by region, 62 per cent <strong>of</strong><strong>the</strong> countries surveyed reported that political parties were<strong>the</strong> most corrupt sector. This trend has increased since2004, when 58 per cent <strong>of</strong> nations saw political parties as<strong>the</strong> most corrupt. As Table 3.2 indicates, when consideredon a regional basis, Asian, Western European and LatinAmerican citizens saw <strong>the</strong>ir political parties as <strong>the</strong> mostcorrupt, while African respondents judged <strong>the</strong>ir police to be<strong>the</strong> sector most corrupt. In Central and Eastern Europe,political parties and <strong>the</strong> police tied for first place as <strong>the</strong> mostcorrupt sectors.Box 3.1 Violence against women in South AfricaSouth Africa has one <strong>of</strong> <strong>the</strong> highest incidences <strong>of</strong> violence against women (and children) in <strong>the</strong>world. <strong>United</strong> <strong>Nations</strong> Office on Drugs and Crime (UNODC) data on crimes reported by <strong>the</strong>police indicate that 123.84 rapes per 100,000 individuals were committed in 2000. This is one <strong>of</strong><strong>the</strong> saddest and most alarming manifestations <strong>of</strong> violence in a society generally regarded astraumatized and wracked by violent crime and (very <strong>of</strong>ten) violent interpersonal and publicbehaviour. Although <strong>the</strong> causes <strong>of</strong> <strong>the</strong> high levels <strong>of</strong> violence in South African society aremanifold and complex, <strong>the</strong>y broadly relate to <strong>the</strong> country’s violent history <strong>of</strong> colonialism andapar<strong>the</strong>id. One can also safely assume that <strong>the</strong> high levels <strong>of</strong> poverty and unemployment in <strong>the</strong>country and <strong>the</strong> resultant economic hardships and frustrations add to <strong>the</strong> already volatile socialand political atmosphere. In addition, patriarchal attitudes, which we share with o<strong>the</strong>r societies,make it particularly difficult for women to attain economic independence. As a result, manywomen are unable to permanently leave <strong>the</strong>ir abusive partners, thus failing to protect<strong>the</strong>mselves and <strong>the</strong>ir children from physical, sexual, emotional, economic and o<strong>the</strong>r forms <strong>of</strong>abuse.Source: Zambuko and Edwards, 2007Petty corruption in <strong>the</strong> way <strong>of</strong> bribery is widespread,but affects poorer countries more significantly than richerones, with some families in Cameroon, Ghana and Nigeriareporting that <strong>the</strong>y spend at least <strong>the</strong> equivalent <strong>of</strong> 20 percent <strong>of</strong> gross domestic product (GDP) per capita on bribery‘taxes’. Of special significance to urban dwellers are <strong>the</strong>bribes paid for services that <strong>the</strong>y would normally be entitledto receive since <strong>the</strong>y tend to be larger recipients <strong>of</strong> servicesthan rural residents. Figure 3.15 shows <strong>the</strong> variation inservice bribery among surveyed nations. Former socialistnations such as Lithuania, Romania, Russia and Ukraine tendto top <strong>the</strong> lists.Corruption is closely linked with organized crime.Indeed, <strong>the</strong> two have been characterized as ‘two sides <strong>of</strong> <strong>the</strong>same coin’. 71 Research on <strong>the</strong> connections between corruptionand organized crime suggests that socio-economicfactors such as poverty, unemployment, societal wealth,income inequality, <strong>the</strong> pattern <strong>of</strong> public investment thatbenefits citizens’ quality <strong>of</strong> life, levels <strong>of</strong> judicial independence,independence <strong>of</strong> civil servants, and <strong>the</strong> strength <strong>of</strong>Box 3.2 Street families and street children in NairobiPetty corruption in<strong>the</strong> way <strong>of</strong> bribery iswidespread, butaffects poorercountries moresignificantly thanricher onesOne <strong>of</strong> <strong>the</strong> major challenges facing urban development in Kenya is <strong>the</strong> growing number <strong>of</strong> streetfamilies. It is estimated <strong>the</strong>re were approximately 115 street children in 1975. By 1990 thisnumber had grown to 17,000 and by 1997 over 150,000. 72 In 2001, <strong>the</strong> number was estimatedto be 250,000 street children countrywide. 73 With older street dwellers included, <strong>the</strong> totalpopulation <strong>of</strong> street persons was estimated at approximately 300,000. The bulk <strong>of</strong> such streetdwellers are found in Nairobi, which at present has approximately 60,000 street persons. Streetfamilies live permanently or part time in <strong>the</strong> central business district area streets, bonded by acommon identity and involved in organized street survival activities within given operational‘territories’. These families operate in environments that lack protection and supervisionmechanisms available in normal social settings.The survival activities include begging, albeit forcefully, pick pocketing and stealing, childprostitution, and <strong>the</strong> use and trafficking <strong>of</strong> drugs. Consequently, <strong>the</strong> public generally perceivesstreet persons as criminals, thieves, drug addicts and eyesores that should be removed from <strong>the</strong>streets. Citizens feel that most ills are <strong>the</strong> responsibility <strong>of</strong> criminals who were previously streetchildren. The public has no mechanisms to respond to <strong>the</strong> manifestations and causes <strong>of</strong> crimeby street children – hence, <strong>the</strong>ir fear and over-generalizations.Source: Masese, 2007


