- Page 2 and 3:
© International Crops Research Ins
- Page 4 and 5:
Project 1: Project 2: Project 3: Pr
- Page 6 and 7:
In April 2005 and again in August 2
- Page 8 and 9:
Handling new districts: Since 1970,
- Page 10 and 11:
food security for their families. E
- Page 12 and 13:
This PRA was followed by a structur
- Page 14 and 15: vary by zone, household, and farm c
- Page 16 and 17: The study hypothesizes that demand
- Page 18 and 19: Collaborating Institutions and Scie
- Page 20 and 21: Objectives: Identify production and
- Page 22 and 23: Research, practice and coalition bu
- Page 24 and 25: initial 2-3 years for smooth transi
- Page 26 and 27: Based on the recommendation of the
- Page 28 and 29: Collaborating Institutions and Scie
- Page 30 and 31: social capital in the nexus of tech
- Page 32 and 33: Scaling out of agricultural technol
- Page 34 and 35: These economic research results hav
- Page 36 and 37: due to population pressure and sub-
- Page 38 and 39: Exploring the dynamics of poverty i
- Page 40 and 41: in the rural Indian diet over the p
- Page 42 and 43: analysis of the sources of risk, ef
- Page 44 and 45: problems that would otherwise invol
- Page 46 and 47: Milestone A.1.1.5: Priorities areas
- Page 48 and 49: environment two entries (2130 - 232
- Page 50 and 51: Output target A.4: Germplasm access
- Page 52 and 53: Milestone A.6.1.2: Wild and cultiva
- Page 54 and 55: (Trifolium alexandrium) (50) and Lu
- Page 56 and 57: greater inflorescence length than a
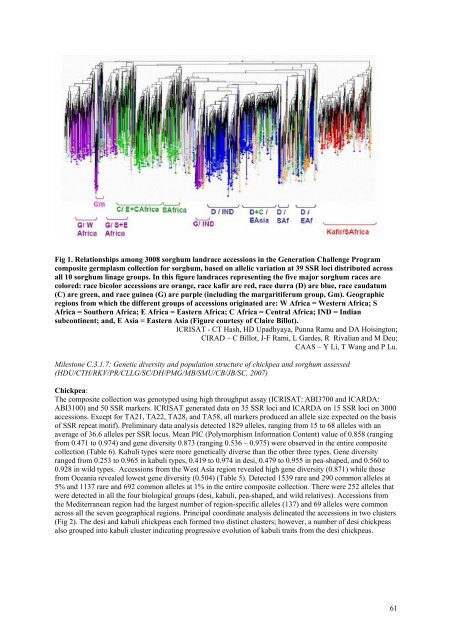
- Page 58 and 59: Output target C.1: Core and mini co
- Page 60 and 61: Pearl millet: We constituted a pear
- Page 62 and 63: Table 5. Number of missing data, al
- Page 66 and 67: Desi (1668); Kabuli (1167); Interme
- Page 68 and 69: (Fig. 3), which maybe attributed to
- Page 70 and 71: Milestone C.3.1.18: Diversity and p
- Page 72 and 73: Milestone C.4.1.2: Core collection
- Page 74 and 75: Milestone C.5.1.8: Foxtail core set
- Page 76 and 77: in both groups. Among the genotypes
- Page 78 and 79: The genotyping of reference collect
- Page 80 and 81: Output target C.9: Broadening the g
- Page 82 and 83: Activity C.11.3: Comparative genomi
- Page 84 and 85: Milestone D.2.1.2: DNA extracts of
- Page 86 and 87: IPC 804 x 81B ) and two tester line
- Page 88 and 89: Project 3 Producing more and better
- Page 90 and 91: during the ongoing off-season. Geno
- Page 92 and 93: glumes make threshing difficult. Th
- Page 94 and 95: organizations, and development proj
- Page 96 and 97: To help guide ICRISAT and West-Afri
- Page 98 and 99: Trait Units Minimum Maximum Mean St
- Page 100 and 101: Activity 3B3.1: Farmer-participator
- Page 102 and 103: Activity 3B6.1: Screening groundnut
- Page 104 and 105: two countries. Formal release has b
- Page 106 and 107: Information was also disseminated u
- Page 108 and 109: Milestone A1.1.2: At least one new
- Page 110 and 111: for localized breeding and testing
- Page 112 and 113: The pearl millet variety SDMV 90031
- Page 114 and 115:
Output Targets A6: High yielding fa
- Page 116 and 117:
will be implemented through researc
- Page 118 and 119:
interpreted with caution. Different
- Page 120 and 121:
Activity A9.3: Share seed of improv
- Page 122 and 123:
proven in target areas. This projec
- Page 124 and 125:
Output Target B5: New backcross pop
- Page 126 and 127:
Activity C2.2: Understand the in si
- Page 128 and 129:
Output 4D: Technological options an
- Page 130 and 131:
Project 5 Producing more and better
- Page 132 and 133:
IS 14384. At 18 days after seedling
- Page 134 and 135:
SFRIL 651151, SFRIL 65278, IS 2205,
- Page 136 and 137:
Grain mold resistance in selections
- Page 138 and 139:
complete block design with three re
- Page 140 and 141:
In another nursery, 384 F 5 s deriv
- Page 142 and 143:
Sweet sorghum male-sterile line dev
- Page 144 and 145:
Seed supplies: A total of 1768 seed
- Page 146 and 147:
through bulk storage and marketing
- Page 148 and 149:
days and 34 flowered in 56−60 day
- Page 150 and 151:
advancement. These 352 progenies al
- Page 152 and 153:
and 834B had 95−98% DM incidence
- Page 154 and 155:
(check IPC 804 flowered in 50 days)
- Page 156 and 157:
Milestone 5A.4.1.1: QTL mapping bas
- Page 158 and 159:
Milestone 5A.5.1.2: Spatial and tem
- Page 160 and 161:
Milestone 5A.7.1.2: Genetical studi
- Page 162 and 163:
fertile hybrids, the promising comb
- Page 164 and 165:
Milestone 5A.4.1.2: A hybrid seed p
- Page 166 and 167:
Milestone 5A.7.1.3: Technical infor
- Page 168 and 169:
Milestone 5B.2.1: Putative relation
- Page 170 and 171:
The phenotyping of F 6 inbred proge
- Page 172 and 173:
Milestone 5B.4.1.1: An effective P-
- Page 174 and 175:
I. Sorghum Output target 5C.1: Sorg
- Page 176 and 177:
Activity 5C.1.2: Conduct inheritanc
- Page 178 and 179:
highest levels of both Fe and Zn, w
- Page 180 and 181:
18 16 14 No. of progenies 12 10 8 6
- Page 182 and 183:
Project 6 Producing more and better
- Page 184 and 185:
equired for disease development. Di
- Page 186 and 187:
In the advanced Spanish type trial
- Page 188 and 189:
TSV infection was recorded both on
- Page 190 and 191:
Genotype Generation Wild species us
- Page 192 and 193:
9 8 7 6 5 4 3 2 1 0 LAD% (JL 24-P2
- Page 194 and 195:
Milestone: Five promising TSVcp tra
- Page 196 and 197:
BPP43-BP-BP-BP) asymptomatic and th
- Page 198 and 199:
a 1 - 9 rating scale. No resistance
- Page 200 and 201:
cross, the F 2 plants were classifi
- Page 202 and 203:
UAS Dharwad-ICRISAT collaborative r
- Page 204 and 205:
selection of material for use as pa
- Page 206 and 207:
damage, numbers of eggs laid, larva
- Page 208 and 209:
Characterization of variability in
- Page 210 and 211:
Milestone: 50 transgenic events of
- Page 212 and 213:
Of the 28 entries tested, 27 entrie
- Page 214 and 215:
Activity 6A.1.2: Genetically divers
- Page 216 and 217:
Wide crosses for pod borer resistan
- Page 218 and 219:
Activity 6A.1.1: Selecting high bio
- Page 220 and 221:
Activity 6A.1.2: Developing QTL map
- Page 222 and 223:
ICRISAT, 8 lines (2.6-1.6 ± 0.13 t
- Page 224 and 225:
The transcription factor DREB1A, wh
- Page 226 and 227:
Milestone: At least 8 promising tra
- Page 228 and 229:
Activity 6B.1.2: Mapping and marker
- Page 230 and 231:
Pigeonpea Output B. Annually knowle
- Page 232 and 233:
Progress reported towards the achie
- Page 234 and 235:
Milestone: Two best transgenic grou
- Page 236 and 237:
Milestone: At least 10 - 15 crosses
- Page 238 and 239:
Milestone: Botanicals with ability
- Page 240 and 241:
Table 2. Screening different botani
- Page 242 and 243:
plots. The results clearly suggest
- Page 244 and 245:
During the Annual Rabi/Summer Seaso
- Page 246 and 247:
Project 7 Reducing Rural Poverty th
- Page 248 and 249:
from both savings in inputs (labor
- Page 250 and 251:
Tomatoes Tomatoes are the most popu
- Page 252 and 253:
Citrulus lanatus Watermelon Malali
- Page 254 and 255:
guidelines were understood from pro
- Page 256 and 257:
Table 7B4. Income distribution of f
- Page 258 and 259:
Table 7B 7. Summary of benefits fro
- Page 260 and 261:
ensure internalization of the sugge
- Page 262 and 263:
goat and cattle management and mark
- Page 264 and 265:
and risk coping strategies of pasto
- Page 266 and 267:
indicators of biodiversity loss, an
- Page 268 and 269:
iological condition as a prerequisi
- Page 270 and 271:
West and Central Africa • Pomme d
- Page 272 and 273:
grazing (in the still grazed plots)
- Page 274 and 275:
2.2.4 Contribution to the overall D
- Page 276 and 277:
example, phane is sold dried withou
- Page 278 and 279:
with sub outcropping that geologica
- Page 280 and 281:
2.1.2 How is it implemented? Napcod
- Page 282 and 283:
Table 4. Six selected FIRMs, their
- Page 284 and 285:
Key problem Key manifestations Effe
- Page 286 and 287:
Key problem Socioeconomic condition
- Page 288 and 289:
2.1.4 Contribution to the overall D
- Page 290 and 291:
2.1.5 Projected potential impact Wi
- Page 292 and 293:
production and rehabilitating the d
- Page 294 and 295:
2.6.2 How is it implemented? Survey
- Page 296 and 297:
leaf manure. Similarly, mango produ
- Page 298 and 299:
This work is carried out in close c
- Page 300 and 301:
indigenous knowledge; Output 1.6 -
- Page 302 and 303:
3. Use of fertilizer micro dosing t
- Page 304 and 305:
sources of income for the rural com
- Page 306 and 307:
2.3.3 Up-scaling the technology The
- Page 308 and 309:
The conversion of local Ziziphus us
- Page 310 and 311:
• The re-appearance of some wild
- Page 312 and 313:
D. Mali 1. The context Land degrada
- Page 314 and 315:
2.2.5 Projected potential impact
- Page 316 and 317:
afford. Another constraint to rehab
- Page 318 and 319:
In all the four countries in WCA, e
- Page 320 and 321:
Project Title “An aflatoxin risk
- Page 322 and 323:
Figure 9A.2. Schematic representati
- Page 324 and 325:
Milestones contributing to Output 9
- Page 326 and 327:
Unfortunately, for most countries g
- Page 328 and 329:
and grain production in almost all
- Page 330 and 331:
a) N stress in the rotation - resid
- Page 332 and 333:
the proposition that resource const
- Page 334 and 335:
Box 9B2 Project initiatives that ar
- Page 336 and 337:
• Fatondji D. Martius C., Bielder
- Page 338 and 339:
potential for use by smallholder fa
- Page 340 and 341:
The first step in the collaboration
- Page 342 and 343:
Table 9B6.Yield of soybean and sunf
- Page 344 and 345:
ii. Long Term Trends In Climate And
- Page 346 and 347:
Table 9B11. Manure effects on the w
- Page 348 and 349:
Each participating farmer grew crop
- Page 350 and 351:
fodder (2.43 t ha -1 ) yields acros
- Page 352 and 353:
additional technological and resour
- Page 354 and 355:
Specific Objectives: • Set up a c
- Page 356 and 357:
learned by piloting the development
- Page 358 and 359:
Journal Articles: Deb UK and BANTIL
- Page 360 and 361:
Journal Articles: Kulkarni VN, Rai
- Page 362 and 363:
Journal Articles: Piara Singh, D VI
- Page 364 and 365:
Journal Articles: Shiferaw B, Obare
- Page 366 and 367:
Conference Proceedings: Akponikpe P
- Page 368 and 369:
Conference Proceedings: Monyo ES, M
- Page 370 and 371:
Conference Proceedings: Shiferaw B,
- Page 372 and 373:
Conference Proceedings: Montpellier
- Page 374 and 375:
Book Chapters: Prabhakar Pathak. 20
- Page 376 and 377:
Book Chapters: Wani SP, MEERA REDDY
- Page 378 and 379:
Monographs: MATI BM. 2006. Prelimin
- Page 380 and 381:
Abstracts: Kileshye Onema J-M, Mazv
- Page 382 and 383:
Brochures/Pamphlets: Hoisington D.
- Page 384 and 385:
Invited Seminars: Dar WD, BHATNAGAR
- Page 386 and 387:
Invited Seminars: December 2006, Sc
- Page 388 and 389:
Invited Seminars: Management in Eth
- Page 390 and 391:
Invited Seminars: Rupela OP. 2006.
- Page 392 and 393:
Invited Seminars: Telugu/English Ne
- Page 394 and 395:
Invited Seminars: Vadez V, Hash CT,
- Page 396 and 397:
Manuals: Diouf A and Pasternak D. 2
- Page 398 and 399:
News Articles/Newsletter: Pradesh,
- Page 400 and 401:
News Articles/Newsletter: Shapiro B
- Page 402 and 403:
Poster Papers: BHATNAGAR-MATHUR P,
- Page 404 and 405:
Poster Papers: Johansen C, Musa AM,
- Page 406 and 407:
Poster Papers: Parthasarathy Rao P,
- Page 408 and 409:
Poster Papers: Upadhyaya HD, BHATTA
- Page 410 and 411:
Electronic modules (Websites) devel
- Page 412 and 413:
Appendix 2. List of Staff Internati
- Page 414 and 415:
Name Title Ashok Alur Project Coord
- Page 416:
Visiting Scientists Consultants Nam