El-BAHITH REVIEW Number 10 _ University Of Ouargla Algeria
Annual refereed journal of applied reserch in economic, commercial and managment sciences
Annual refereed journal of applied reserch in economic, commercial and managment sciences

Create successful ePaper yourself
Turn your PDF publications into a flip-book with our unique Google optimized e-Paper software.
___________________________________________<br />
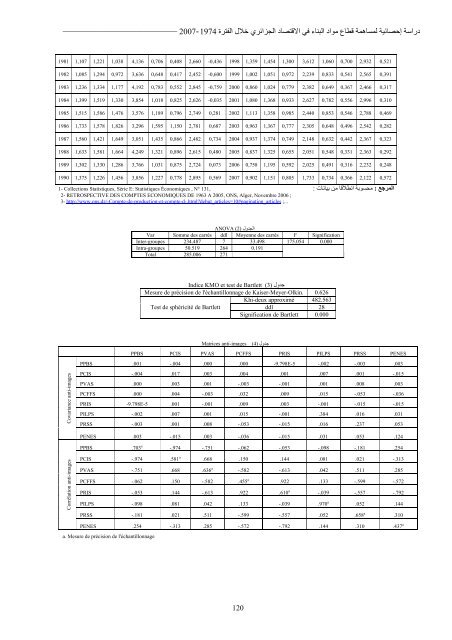
دراسة إحصائية لمساهمة قطاع مواد البناء في الاقتصاد الجزائري خلال الفترة 2007-1974<br />
1981 1,<strong>10</strong>7 1,221 1,038 4,136 0,706 0,408 2,660 -0,436 1998 1,359 1,454 1,300 3,612 1,060 0,700 2,932 0,521<br />
1982 1,085 1,294 0,972 3,636 0,648 0,417 2,452 -0,600 1999 1,002 1,051 0,972 2,239 0,833 0,541 2,565 0,391<br />
1983 1,236 1,334 1,177 4,192 0,783 0,552 2,845 -0,759 2000 0,860 1,024 0,779 2,382 0,649 0,367 2,466 0,317<br />
1984 1,399 1,519 1,330 3,854 1,018 0,825 2,626 -0,035 2001 1,080 1,368 0,933 2,627 0,782 0,556 2,996 0,3<strong>10</strong><br />
1985 1,515 1,586 1,476 3,576 1,189 0,796 2,749 0,281 2002 1,113 1,358 0,985 2,440 0,853 0,546 2,788 0,469<br />
1986 1,733 1,578 1,826 3,296 1,595 1,150 2,781 0,687 2003 0,963 1,367 0,777 2,305 0,648 0,496 2,542 0,282<br />
1987 1,560 1,421 1,649 3,051 1,435 0,866 2,482 0,734 2004 0,937 1,374 0,749 2,148 0,632 0,442 2,367 0,323<br />
1988 1,633 1,581 1,664 4,249 1,321 0,896 2,615 0,480 2005 0,837 1,325 0,655 2,051 0,548 0,331 2,363 0,292<br />
1989 1,302 1,330 1,286 3,766 1,031 0,875 2,724 0,073 2006 0,758 1,195 0,592 2,025 0,491 0,316 2,232 0,248<br />
1990 1,375 1,226 1,456 3,856 1,227 0,778 2,895 0,569 2007 0,902 1,151 0,805 1,733 0,734 0,366 2,122 0,572<br />
1- Collections Statistiques, Série E: Statistiques Économiques , N° 131,<br />
2- RETROSPECTIVE DES COMPTES ECONOMIQUES DE 1963 A 2005, ONS, Alger, Novembre 2006 ;<br />
3- http://www.ons.dz/-Compte-de-production-et-compte-d-.html?debut_articles=<strong>10</strong>#pagination_articles ;...<br />
المرجع : محسوبة انطلاقا من بيانات :<br />
الجدول 2) ( ANOVA<br />
Var Somme des carrés ddl Moyenne des carrés F Signification<br />
Inter-groupes 234.487 7 33.498 175.054 0.000<br />
Intra-groupes 50.519 264 0.191<br />
Total 285.006 271<br />
Bartlett Indice KMO et test de<br />
جدول 3) ( Mesure de précision de l'échantillonnage de Kaiser-Meyer-Olkin. 0.626<br />
Khi-deux approximé 482.563<br />
Test de sphéricité de Bartlett<br />
ddl 28<br />
Signification de Bartlett 0.000<br />
جدول (4) anti-images Matrices<br />
PPBS PCIS PVAS PCFFS PRIS PILPS PRSS PENES<br />
PPBS .001 -.004 .000 .000 -9.798E-5 -.002 -.003 .003<br />
Covariance anti-images<br />
PCIS -.004 .017 .003 .004 .001 .007 .001 -.015<br />
PVAS .000 .003 .001 -.003 -.001 .001 .008 .003<br />
PCFFS .000 .004 -.003 .032 .009 .015 -.053 -.036<br />
PRIS -9.798E-5 .001 -.001 .009 .003 -.001 -.015 -.015<br />
PILPS -.002 .007 .001 .015 -.001 .384 .016 .031<br />
PRSS -.003 .001 .008 -.053 -.015 .016 .237 .053<br />
PENES .003 -.015 .003 -.036 -.015 .031 .053 .124<br />
PPBS .703 a -.974 -.751 -.062 -.053 -.098 -.181 .254<br />
Corrélation anti-images<br />
PCIS -.974 .581 a .668 .150 .144 .081 .021 -.313<br />
PVAS -.751 .668 .636 a -.582 -.613 .042 .511 .285<br />
PCFFS -.062 .150 -.582 .455 a .922 .133 -.599 -.572<br />
PRIS -.053 .144 -.613 .922 .6<strong>10</strong> a -.039 -.557 -.792<br />
PILPS -.098 .081 .042 .133 -.039 .970 a .052 .144<br />
PRSS -.181 .021 .511 -.599 -.557 .052 .658 a .3<strong>10</strong><br />
PENES .254 -.313 .285 -.572 -.792 .144 .3<strong>10</strong> .437 a<br />
a. Mesure de précision de l'échantillonnage<br />
120