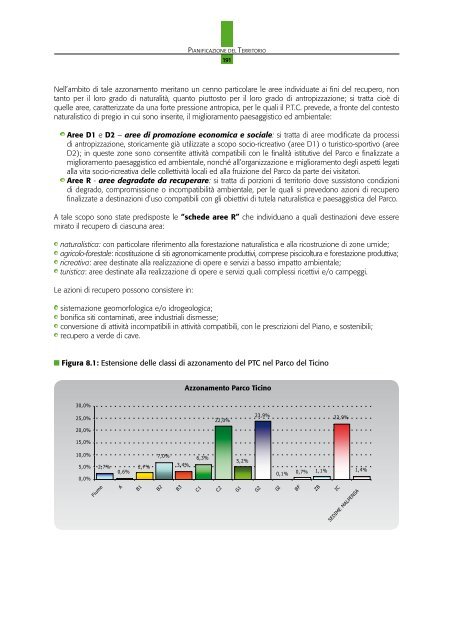
PIANIFICAZIONE DEL TERRITORIO 191 Nell’ambito di tale azzonamento meritano un cenno particolare le aree individuate ai fini <strong>del</strong> recupero, non tanto per il loro grado di naturalità, quanto piuttosto per il loro grado di antropizzazione; si tratta cioè di quelle aree, caratterizzate da una forte pressione antropica, per le quali il P.T.C. prevede, a fronte <strong>del</strong> contesto naturalistico di pregio in cui sono inserite, il miglioramento paesaggistico ed ambientale: Aree D1 e D2 – aree di promozione economica e sociale: si tratta di aree modificate da processi di antropizzazione, storicamente già utilizzate a scopo socio-ricreativo (aree D1) o turistico-sportivo (aree D2); in queste zone sono consentite attività compatibili con le finalità istitutive <strong>del</strong> <strong>Parco</strong> e finalizzate a miglioramento paesaggistico ed ambientale, nonché all’organizzazione e miglioramento degli aspetti legati alla vita socio-ricreativa <strong>del</strong>le collettività locali ed alla fruizione <strong>del</strong> <strong>Parco</strong> da parte dei visitatori. Aree R - aree degradate da recuperare: si tratta di porzioni di territorio dove sussistono condizioni di degrado, compromissione o incompatibilità ambientale, per le quali si prevedono azioni di recupero finalizzate a destinazioni d’uso compatibili con gli obiettivi di tutela naturalistica e paesaggistica <strong>del</strong> <strong>Parco</strong>. A tale scopo sono state predisposte le “schede aree R” che individuano a quali destinazioni deve essere mirato il recupero di ciascuna area: naturalistica: con particolare riferimento alla forestazione naturalistica e alla ricostruzione di zone umide; agricolo-forestale: ricostituzione di siti agronomicamente produttivi, comprese piscicoltura e forestazione produttiva; ricreativa: aree destinate alla realizzazione di opere e servizi a basso impatto ambientale; turistica: aree destinate alla realizzazione di opere e servizi quali complessi ricettivi e/o campeggi. Le azioni di recupero possono consistere in: sistemazione geomorfologica e/o idrogeologica; bonifica siti contaminati, aree industriali dismesse; conversione di attività incompatibili in attività compatibili, con le prescrizioni <strong>del</strong> Piano, e sostenibili; recupero a verde di cave. Figura 8.1: Estensione <strong>del</strong>le classi di azzonamento <strong>del</strong> PTC nel <strong>Parco</strong> <strong>del</strong> <strong>Ticino</strong> 30,0% 25,0% 20,0% 15,0% 10,0% 5,0% 0,0% 2,7% 0,6% 2,7% Fiume A B1 B2 7,0% B3 Azzonamento <strong>Parco</strong> <strong>Ticino</strong> Azzonamento <strong>Parco</strong> <strong>Ticino</strong> 3,4% C1 6,3% 22,0% C2 G1 5,2% 23,9% G2 GI 0,1% 0,7% 1,1% BF ZB 22,9% IC SEDIME MALPENSA 1,4%
PIANIFICAZIONE DEL TERRITORIO 192 Tabella 8.1: Superfici (in ettari) <strong>del</strong>le classi di azzonamento <strong>del</strong> PTC <strong>del</strong> <strong>Parco</strong> <strong>del</strong> <strong>Ticino</strong> suddivisi per Comune Comune Fiume A B1 B2 B3 C1 C2 G1 G2 GI BF ZB IC SEDIME MALPENSA ABBIATEGRASSO 105,79 12,98 277,9 555,01 259,89 302,9 1272,9 974,17 915,01 ARSAGO SEPRIO 569,25 0,07 218,91 249,85 BEREGUARDO 100,29 22,03 401,34 153,52 265,74 95,53 234,87 326,73 143,1 BERNATE TICINO 59,31 42,57 213,16 30,05 233,65 97,86 258,29 277,77 BESATE 18,43 67,25 141,83 151,18 100,39 326,91 345,81 108,85 BESNATE 329,13 46,38 47,94 346,65 BOFFALORA S/T 43,02 44,77 6,55 33,77 61,98 201,26 62,14 291,1 BORGO SAN SIRO 0,02 35,87 47,25 138,08 79,35 26,68 496,22 865,49 80,14 BUSCATE 224,1 202,26 88,24 263,42 CARBONARA TICINO 30,17 3,37 165,2 5,99 416,86 616,73 217,16 97,98 CARDANO AL CAMPO 331,77 491,21 119,01 CASORATE SEMPIONE CASSINETTA DI 14,16 365,35 263,33 53,88 LUGAGNANO 243,5 90,6 CASSOLNOVO 112,44 187,57 206,79 80,82 98,21 1322,72 815,5 377,23 CASTANO PRIMO 4,27 30,64 11,42 52,89 10,46 53,63 599,46 556,6 590,27 CUGGIONO 61,52 2,58 132,52 35,58 182,46 75,83 561,93 433,84 FERNO 99,21 296,85 478,14 GALLARATE 299,23 193,72 32,69 1570,38 GAMBOLO' 25,4 108,95 169,33 312,75 230,09 51,8 1063,98 3000,47 494,81 GARLASCO 792,22 2060,91 41,79 274,6 733,62 GOLASECCA 25,3 83,3 16,33 468,45 156,26 GROPELLO CAIROLI 651,22 1452,88 147,22 36,68 338,84 LINAROLO 220,77 216,5 101,09 22,49 91,41 502,83 146,71 LONATE POZZOLO 62,35 10,44 173,04 76,32 91,47 96,08 100 1339,95 693,46 238,64 MAGENTA 1,08 219,05 0,79 1,45 161,31 515,81 362,3 921,81 MEZZANINO 92,69 278,34 103,89 618,52 159,16 MORIMONDO 5,97 46,78 173,99 191,57 102,38 725,95 1159,3 104,29 85,85 MOTTA VISCONTI 42,76 46,69 1,18 224,57 112,87 92,92 216,12 312,13 NOSATE 15,75 157,1 27,42 17,58 34,87 93,59 100,66 1,14 52,67 OZZERO 0,07 0,4 16,66 359,65 359,65 359,72 140,71 PAVIA ROBECCHETTO 178,41 433,93 221,32 354,75 38,29 2472,19 189,79 2400,15 CON INDUNO 24,62 69,29 228,62 32,57 182,96 358,85 167,97 331,56 ROBECCO SUL NAVIGLIO 37 227,86 33,72 53,81 27,55 636,9 714,78 310,44 SAMARATE 808,33 733,45 43,51 SAN MARTINO SICCOMARIO 66,97 147,21 442,95 457,91 254,02 SESTO CALENDE 299,76 0,24 1338,76 135,33 727,71 SOMMA LOMBARDO 78,59 511,54 66,34 445,76 304,62 441,66 61,2 854,01 280,16 TORRE D'ISOLA 85,1 1,12 57,32 117,49 308 214,16 248,2 445,37 161,09 TRAVACO' SICCOMARIO 139,92 310,36 288,12 109,8 550,01 186,89 TURBIGO 28,44 69,79 118,59 1,13 112,59 56,72 0,63 466,04 VALLE SALIMBENE 58,67 56,64 48,95 12,5 136,47 400,18 78,87 VANZAGHELLO 268,76 284,86 VERGIATE 1214,74 269,66 597,8 VIGEVANO 275,94 158,37 172,74 730,28 158,97 208,51 2646,15 1222,14 83,24 2253,08 VILLANOVA D'ARDENGHI 213,67 279,35 75,1 VIZZOLA TICINO 81,08 267,19 155,88 183,83 70,88 22,93 ZERBOLO' 141,15 18,46 158,2 445,94 561,54 1111,18 1214,07 4,57 1,01 90,65 TOTALE 2456,01 528,94 2512,96 6439,97 3114,13 5731,74 20113,81 4772,97 21874,3 79,14 655,77 1048,7 21000,21 1236,27
- Page 2:
Ticino 21 1° Rapporto sullo Stato
- Page 5 and 6:
Il Rapporto sullo Stato dell’Ambi
- Page 7 and 8:
INDICE 6 CAPITOLO 6: ARIA pag. 137
- Page 10:
LA STRUTTURA DEL RAPPORTO SULLO STA
- Page 13 and 14:
LA STRUTTURA DEL RAPPORTO SULLO STA
- Page 15 and 16:
seguente dedicata all’inquadramen
- Page 17 and 18:
LA STRUTTURA DEL RAPPORTO SULLO STA
- Page 20 and 21:
STRUTTURA DEL PARCO 19 CAPITOLO 1 S
- Page 22 and 23:
STRUTTURA DEL PARCO 21 La quota di
- Page 24 and 25:
STRUTTURA DEL PARCO 23 Presidente I
- Page 26 and 27:
STRUTTURA DEL PARCO - Bonifiche agr
- Page 28 and 29:
STRUTTURA DEL PARCO - Monitoraggio
- Page 30 and 31:
STRUTTURA DEL PARCO 29 o in prossim
- Page 32:
ACQUA 31 CAPITOLO 2 ACQUA
- Page 35 and 36:
ACQUA 34 Il Ticino, dopo aver alime
- Page 37 and 38:
ACQUA 36 Gli indicatori Tramite gli
- Page 39 and 40:
ACQUA Tabella 2.3. Risultati di IBE
- Page 41 and 42:
Media valori I.B.E. ACQUA Figura 2.
- Page 43 and 44:
ACQUA 42 Tabella 2.10: Dati relativ
- Page 45 and 46:
480 - 520 240 - 475 120 - 235 60 -
- Page 47 and 48:
ACQUA 46 Fiume Ticino Di seguito si
- Page 49 and 50:
ACQUA 48 Le analisi eseguite nel 20
- Page 51 and 52:
1.000 0,300 0,200 Dati Biologici 65
- Page 53 and 54:
Stazione C1 5,6 6 6,4 6 6 6 III C2
- Page 55 and 56:
UFC/100ml Stazione RR1 RR2 RR3 UFC/
- Page 57 and 58:
ACQUA 56 La balneabilità La normat
- Page 59 and 60:
ACQUA 58 Il Parco del Ticino in co
- Page 61 and 62:
ACQUA Prelievi per scopi irrigui e
- Page 63 and 64:
ACQUA Tali impianti di depurazione
- Page 65 and 66:
TABELLA 1 I LIMITI DI EMISSIONE PER
- Page 67 and 68:
Sintesi degli indicatori Stato indi
- Page 70:
VEGETAZIONE 69 CAPITOLO 3 VEGETAZIO
- Page 73 and 74:
VEGETAZIONE 72 può solo consistere
- Page 75 and 76:
Gli indicatori VEGETAZIONE 74 Super
- Page 77 and 78:
VEGETAZIONE 76 Percentuale di terri
- Page 79 and 80:
VEGETAZIONE 78 Figura 3.7: Distribu
- Page 81 and 82:
VEGETAZIONE Tabella 3.6: Superfici
- Page 83 and 84:
VEGETAZIONE 82 Approfondimento LE S
- Page 85 and 86:
VEGETAZIONE Olmo campestre (Ulmus m
- Page 87 and 88:
VEGETAZIONE Tabella 3.12: Consorzi
- Page 89 and 90:
VEGETAZIONE 88 I boschi del Ticino
- Page 92 and 93:
Inquadramento generale FAUNA E BIOD
- Page 94 and 95:
FAUNA E BIODIVERSITÀ 93 I motivi c
- Page 96 and 97:
FAUNA E BIODIVERSITÀ 95 Decreto de
- Page 98 and 99:
FAUNA E BIODIVERSITÀ 97 Tabella 4.
- Page 100 and 101:
FAUNA E BIODIVERSITÀ 99 alterate c
- Page 102 and 103:
FAUNA E BIODIVERSITÀ 101 Siluro e
- Page 104 and 105:
FAUNA E BIODIVERSITÀ Tabella 4.3:
- Page 106 and 107:
FAUNA E BIODIVERSITÀ 105 Tabella 4
- Page 108 and 109:
FAUNA E BIODIVERSITÀ 107 Cicogna n
- Page 110 and 111:
FAUNA E BIODIVERSITÀ 109 dell’ec
- Page 112 and 113:
Sintesi degli indicatori
- Page 114:
SUOLO E ASSETTO IDROGEOLOGICO 113 C
- Page 117 and 118:
SUOLO E ASSETTO IDROGEOLOGICO 116 p
- Page 119 and 120:
SUOLO E ASSETTO IDROGEOLOGICO 118 A
- Page 121 and 122:
SUOLO E ASSETTO IDROGEOLOGICO 120 A
- Page 123 and 124:
SUOLO E ASSETTO IDROGEOLOGICO 122 d
- Page 125 and 126:
SUOLO E ASSETTO IDROGEOLOGICO Tabel
- Page 127 and 128:
SUOLO E ASSETTO IDROGEOLOGICO 126 e
- Page 129 and 130:
SUOLO E ASSETTO IDROGEOLOGICO 128 A
- Page 131 and 132:
SUOLO E ASSETTO IDROGEOLOGICO 130 -
- Page 133 and 134:
SUOLO E ASSETTO IDROGEOLOGICO 132 r
- Page 135 and 136:
SUOLO E ASSETTO IDROGEOLOGICO 134 S
- Page 137 and 138:
con macerie (Km) 1,15 contenere
- Page 140 and 141:
Inquadramento generale ARIA 139 CAP
- Page 142 and 143: ARIA 141 è la standardizzazione de
- Page 144 and 145: ARIA 143 La soglia di allarme è pa
- Page 146 and 147: La tabella 7.2 riassume le principa
- Page 148 and 149: ARIA 147 Nelle tabelle seguenti son
- Page 150 and 151: ARIA 149 Monitoraggio con postazion
- Page 152 and 153: ARIA 151 stati immessi in atmosfera
- Page 154 and 155: ARIA 153 Figura 7.5: Carta della qu
- Page 156 and 157: ARIA 155 piuttosto una pressione di
- Page 158: AGRICOLTURA 157 CAPITOLO 7 AGRICOLT
- Page 161 and 162: AGRICOLTURA 160 Per fornire un quad
- Page 163 and 164: AGRICOLTURA 162 l’ottimizzazione
- Page 165 and 166: AGRICOLTURA Tabella 6.1: Superficie
- Page 167 and 168: AGRICOLTURA 166 Dai dati emergono a
- Page 169 and 170: AGRICOLTURA 168 Tabella 6.7: Andame
- Page 171 and 172: AGRICOLTURA 170 possibilità di lis
- Page 173 and 174: AGRICOLTURA 172 Tabella 6.12: Dati
- Page 175 and 176: Miglioramento ambientale del territ
- Page 177 and 178: 4033 3303 423 2418 AGRICOLTURA Figu
- Page 179 and 180: AGRICOLTURA 178 Approfondimento IL
- Page 181 and 182: Pressione Risposta Risposta Pressio
- Page 184: PIANIFICAZIONE DEL TERRITORIO 183 C
- Page 187 and 188: PIANIFICAZIONE DEL TERRITORIO 186 A
- Page 189 and 190: PIANIFICAZIONE DEL TERRITORIO 188 I
- Page 191: PIANIFICAZIONE DEL TERRITORIO 190 t
- Page 195 and 196: PIANIFICAZIONE DEL TERRITORIO 194 I
- Page 197 and 198: PIANIFICAZIONE DEL TERRITORIO 196 E
- Page 199 and 200: PIANIFICAZIONE DEL TERRITORIO 198 R
- Page 201 and 202: PIANIFICAZIONE DEL TERRITORIO 200 a
- Page 203 and 204: PIANIFICAZIONE DEL TERRITORIO 202 A
- Page 205 and 206: PIANIFICAZIONE DEL TERRITORIO 204 a
- Page 207 and 208: PIANIFICAZIONE DEL TERRITORIO 206 o
- Page 209 and 210: PIANIFICAZIONE DEL TERRITORIO 208 R
- Page 211 and 212: PIANIFICAZIONE DEL TERRITORIO 210 d
- Page 214: PAESAGGIO 213 CAPITOLO 9 PAESAGGIO
- Page 217 and 218: PAESAGGIO 216 scala locale, l’att
- Page 219 and 220: PAESAGGIO 218 costituisce la normat
- Page 221 and 222: PAESAGGIO 220 (marcite), unitamente
- Page 223 and 224: PAESAGGIO 222 Figura 9.1: Carte di
- Page 225 and 226: PAESAGGIO 224 Gli indicatori Uso de
- Page 227 and 228: PAESAGGIO Tabella 9.2: Elenco dei 1
- Page 230: TURISMO E FRUIZIONE 229 CAPITOLO 10
- Page 233 and 234: TURISMO E FRUIZIONE 232 Gli indicat
- Page 235 and 236: TURISMO E FRUIZIONE 234 Conoscenza
- Page 237 and 238: TURISMO E FRUIZIONE Tabella 10.2. L
- Page 239 and 240: TURISMO E FRUIZIONE 238 Nel Parco d
- Page 241 and 242: TURISMO E FRUIZIONE 240 I visitator
- Page 243 and 244:
TURISMO E FRUIZIONE 242 Nonostante
- Page 246 and 247:
Inquadramento generale RIFIUTI 245
- Page 248 and 249:
RIFIUTI 247 Gli indicatori Discaric
- Page 250 and 251:
RIFIUTI 249 Figura 11.2: Produzione
- Page 252 and 253:
RIFIUTI 251 I dati aggregati riport
- Page 254 and 255:
RIFIUTI 253 Figura 11.7: Percentual
- Page 256 and 257:
RIFIUTI 255 Approfondimento IL RUOL
- Page 258:
RUMORE 257 CAPITOLO 12 RUMORE
- Page 261 and 262:
RUMORE Tabella 12.1: Livelli sonori
- Page 263 and 264:
RUMORE 262 maggiormente uniformi le
- Page 265 and 266:
RUMORE 264 di Varese, Milano e Pavi
- Page 267 and 268:
RUMORE 266 reti costituite nell’a
- Page 269 and 270:
60,5 61,6 54,7 51,9 62 RUMORE 268 F
- Page 271 and 272:
RUMORE 270 tratti del fiume ove son
- Page 274:
ENERGIA 273 CAPITOLO 13 ENERGIA
- Page 277 and 278:
ENERGIA 276 loco” da fonti rinnov
- Page 279 and 280:
ENERGIA 278 Gli indicatori Energia
- Page 281 and 282:
TOT Parco VARESE Totale Parco Regio
- Page 283 and 284:
ENERGIA 282 3. Valorizzazione delle
- Page 286:
TRASPORTI E MOBILITA’ 285 CAPITOL
- Page 289 and 290:
TRASPORTI E MOBILITA’ 288 raccord
- Page 291 and 292:
TRASPORTI E MOBILITA’ 290 uno svi
- Page 293 and 294:
6 Cuggiono 189.710 30.912 4.874 225
- Page 295 and 296:
TRASPORTI E MOBILITA’ 294 espress
- Page 297 and 298:
TRASPORTI E MOBILITA’ Figura 14.6
- Page 299 and 300:
TRASPORTI E MOBILITA’ 298 realizz
- Page 301 and 302:
Sintesi degli indicatori Stato indi
- Page 304:
RISCHIO INDUSTRIALE 303 CAPITOLO 15
- Page 307 and 308:
RISCHIO INDUSTRIALE 306 Queste due
- Page 309 and 310:
RISCHIO INDUSTRIALE Tabella 15.2: C
- Page 311 and 312:
RISCHIO INDUSTRIALE 310 Tabella 15.
- Page 313 and 314:
RISCHIO INDUSTRIALE 312 Tabella 15.
- Page 315 and 316:
EA AZIENDA UBICAZIONE CATEGORIA MER
- Page 317 and 318:
EA AZIENDA UBICAZIONE CATEGORIA MER
- Page 319 and 320:
EA AZIENDA UBICAZIONE CATEGORIA MER
- Page 321 and 322:
Sintesi degli indicatori Stato indi
- Page 324:
ILLECITI E REATI AMBIENTALI 323 CAP
- Page 327 and 328:
ILLECITI E REATI AMBIENTALI 326 mon
- Page 329 and 330:
ILLECITI E REATI AMBIENTALI Grafico
- Page 331 and 332:
Sintesi degli indicatori Sintesi de
- Page 334 and 335:
CONCLUSIONI 333 CAPITOLO 17 CONCLUS
- Page 336 and 337:
CONCLUSIONI 335 tempo. Occorre quin
- Page 338 and 339:
CONCLUSIONI 337 condotte per tutela
- Page 340 and 341:
CONCLUSIONI 339 produzione di legna
- Page 342 and 343:
CONCLUSIONI 341 ammendanti) nel set
- Page 344 and 345:
CONCLUSIONI 343 di scale di risalit
- Page 346 and 347:
CONCLUSIONI 345 studio, volontario
- Page 348 and 349:
CONCLUSIONI 347 dell’approvvigion
- Page 350 and 351:
CONCLUSIONI 349 Infatti, se è vero
- Page 352 and 353:
CONCLUSIONI 351 fosse sempre “con
- Page 354:
MONITORAGGIO AGENDA 21 NEL PARCO DE
- Page 357 and 358:
Agende 21 dichiarate, con sottoscri
- Page 359 and 360:
L’analisi dei dati della rilevazi
- Page 361 and 362:
MONITORAGGIO AGENDA 21 NEL PARCO DE
- Page 363 and 364:
MONITORAGGIO AGENDA 21 NEL PARCO DE
- Page 365 and 366:
Abbiategrasso Carta riciclata Boffa
- Page 367 and 368:
Esistono definiti? dei gruppi temat
- Page 370 and 371:
IL PATRIMONIO DEL PARCO 369 ALLEGAT
- Page 372 and 373:
IL PATRIMONIO DEL PARCO Complessiva
- Page 374:
BIBLIOGRAFIA 373 BIBLIOGRAFIA
- Page 377 and 378:
Dati del Settore PERSONALE del Parc
- Page 379 and 380:
2002. Consorzio Parco Ticino. BIBLI
- Page 382 and 383:
PUBBLICAZIONI TECNICHE E SCIENTIFIC
- Page 384 and 385:
Si raccomanda per la citazione bibl