Hør dog hvad de siger - Note-to-Self: Trials & Errors
Hør dog hvad de siger - Note-to-Self: Trials & Errors
Hør dog hvad de siger - Note-to-Self: Trials & Errors

You also want an ePaper? Increase the reach of your titles
YUMPU automatically turns print PDFs into web optimized ePapers that Google loves.
clu<strong>de</strong>d. As one can see the populations are split roughly at 50-50% <strong>to</strong> 40-60% “high”/”low”<br />
education across all societies which would seem <strong>to</strong> justify the division 8 .<br />
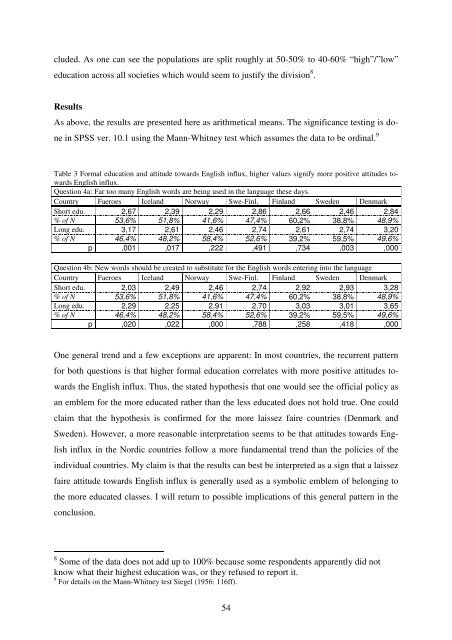
Results<br />
As above, the results are presented here as arithmetical means. The significance testing is do-<br />
ne in SPSS ver. 10.1 using the Mann-Whitney test which assumes the data <strong>to</strong> be ordinal. 9<br />
Table 3 Formal education and attitu<strong>de</strong> <strong>to</strong>wards English influx, higher values signify more positive attitu<strong>de</strong>s <strong>to</strong>wards<br />
English influx.<br />
Question 4a: Far <strong>to</strong>o many English words are being used in the language these days.<br />
Country Faeroes Iceland Norway Swe-Finl. Finland Swe<strong>de</strong>n Denmark<br />
Short edu. 2,67 2,39 2,29 2,86 2,66 2,46 2,84<br />
% of N 53,6% 51,8% 41,6% 47,4% 60,2% 38,8% 48,9%<br />
Long edu. 3,17 2,61 2,46 2,74 2,61 2,74 3,20<br />
% of N 46,4% 48,2% 58,4% 52,6% 39,2% 59,5% 49,6%<br />
p ,001 ,017 ,222 ,491 ,734 ,003 ,000<br />
Question 4b: New words should be created <strong>to</strong> substitute for the English words entering in<strong>to</strong> the language<br />
Country Faeroes Iceland Norway Swe-Finl. Finland Swe<strong>de</strong>n Denmark<br />
Short edu. 2,03 2,49 2,46 2,74 2,92 2,93 3,28<br />
% of N 53,6% 51,8% 41,6% 47,4% 60,2% 38,8% 48,9%<br />
Long edu. 2,29 2,25 2,91 2,70 3,03 3,01 3,65<br />
% of N 46,4% 48,2% 58,4% 52,6% 39,2% 59,5% 49,6%<br />
p ,020 ,022 ,000 ,788 ,258 ,418 ,000<br />
One general trend and a few exceptions are apparent: In most countries, the recurrent pattern<br />
for both questions is that higher formal education correlates with more positive attitu<strong>de</strong>s <strong>to</strong>-<br />
wards the English influx. Thus, the stated hypothesis that one would see the official policy as<br />
an emblem for the more educated rather than the less educated does not hold true. One could<br />
claim that the hypothesis is confirmed for the more laissez faire countries (Denmark and<br />
Swe<strong>de</strong>n). However, a more reasonable interpretation seems <strong>to</strong> be that attitu<strong>de</strong>s <strong>to</strong>wards Eng-<br />
lish influx in the Nordic countries follow a more fundamental trend than the policies of the<br />
individual countries. My claim is that the results can best be interpreted as a sign that a laissez<br />
faire attitu<strong>de</strong> <strong>to</strong>wards English influx is generally used as a symbolic emblem of belonging <strong>to</strong><br />
the more educated classes. I will return <strong>to</strong> possible implications of this general pattern in the<br />
conclusion.<br />
8 Some of the data does not add up <strong>to</strong> 100% because some respon<strong>de</strong>nts apparently did not<br />
know what their highest education was, or they refused <strong>to</strong> report it.<br />
9 For <strong>de</strong>tails on the Mann-Whitney test Siegel (1956: 116ff).<br />
54