TRADITIONAL POSTER - ismrm
TRADITIONAL POSTER - ismrm
TRADITIONAL POSTER - ismrm

Create successful ePaper yourself
Turn your PDF publications into a flip-book with our unique Google optimized e-Paper software.
Poster Sessions<br />
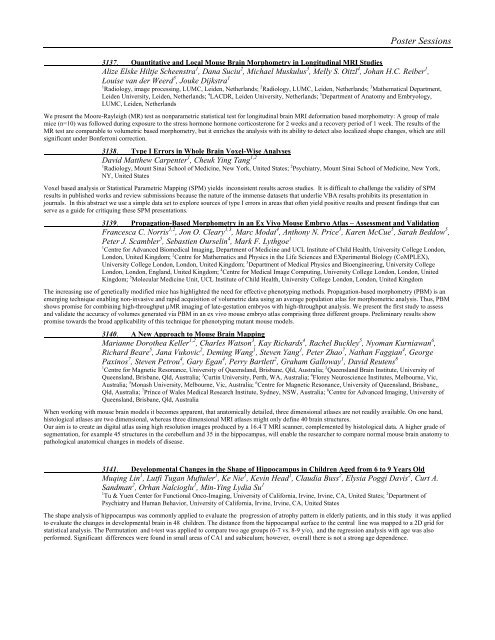
3137. Quantitative and Local Mouse Brain Morphometry in Longitudinal MRI Studies<br />
Alize Elske Hiltje Scheenstra 1 , Dana Suciu 2 , Michael Muskulus 3 , Melly S. Oitzl 4 , Johan H.C. Reiber 1 ,<br />
Louise van der Weerd 5 , Jouke Dijkstra 1<br />
1 Radiology, image processing, LUMC, Leiden, Netherlands; 2 Radiology, LUMC, Leiden, Netherlands; 3 Mathematical Department,<br />
Leiden University, Leiden, Netherlands; 4 LACDR, Leiden University, Netherlands; 5 Department of Anatomy and Embryology,<br />
LUMC, Leiden, Netherlands<br />
We present the Moore-Rayleigh (MR) test as nonparametric statistical test for longitudinal brain MRI deformation based morphometry: A group of male<br />
mice (n=10) was followed during exposure to the stress hormone hormone corticosterone for 2 weeks and a recovery period of 1 week. The results of the<br />
MR test are comparable to volumetric based morphometry, but it enriches the analysis with its ability to detect also localized shape changes, which are still<br />
significant under Bonferroni correction.<br />
3138. Type I Errors in Whole Brain Voxel-Wise Analyses<br />
David Matthew Carpenter 1 , Cheuk Ying Tang 1,2<br />
1 Radiology, Mount Sinai School of Medicine, New York, United States; 2 Psychiatry, Mount Sinai School of Medicine, New York,<br />
NY, United States<br />
Voxel based analysis or Statistical Parametric Mapping (SPM) yields inconsistent results across studies. It is difficult to challenge the validity of SPM<br />
results in published works and review submissions because the nature of the immense datasets that underlie VBA results prohibits its presentation in<br />
journals. In this abstract we use a simple data set to explore sources of type I errors in areas that often yield positive results and present findings that can<br />
serve as a guide for critiquing these SPM presentations.<br />
3139. Propagation-Based Morphometry in an Ex Vivo Mouse Embryo Atlas – Assessment and Validation<br />
Francesca C. Norris 1,2 , Jon O. Cleary 1,3 , Marc Modat 4 , Anthony N. Price 1 , Karen McCue 5 , Sarah Beddow 5 ,<br />
Peter J. Scambler 5 , Sebastien Ourselin 4 , Mark F. Lythgoe 1<br />
1 Centre for Advanced Biomedical Imaging, Department of Medicine and UCL Institute of Child Health, University College London,<br />
London, United Kingdom; 2 Centre for Mathematics and Physics in the Life Sciences and EXperimental Biology (CoMPLEX),<br />
University College London, London, United Kingdom; 3 Department of Medical Physics and Bioengineering, University College<br />
London, London, England, United Kingdom; 4 Centre for Medical Image Computing, University College London, London, United<br />
Kingdom; 5 Molecular Medicine Unit, UCL Institute of Child Health, University College London, London, United Kingdom<br />
The increasing use of genetically modified mice has highlighted the need for effective phenotyping methods. Propagation-based morphometry (PBM) is an<br />
emerging technique enabling non-invasive and rapid acquisition of volumetric data using an average population atlas for morphometric analysis. Thus, PBM<br />
shows promise for combining high-throughput µMR imaging of late-gestation embryos with high-throughput analysis. We present the first study to assess<br />
and validate the accuracy of volumes generated via PBM in an ex vivo mouse embryo atlas comprising three different groups. Preliminary results show<br />
promise towards the broad applicability of this technique for phenotyping mutant mouse models.<br />
3140. A New Approach to Mouse Brain Mapping<br />
Marianne Dorothea Keller 1,2 , Charles Watson 3 , Kay Richards 4 , Rachel Buckley 5 , Nyoman Kurniawan 6 ,<br />
Richard Beare 5 , Jana Vukovic 2 , Deming Wang 1 , Steven Yang 1 , Peter Zhao 7 , Nathan Faggian 4 , George<br />
Paxinos 7 , Steven Petrou 4 , Gary Egan 4 , Perry Bartlett 2 , Graham Galloway 1 , David Reutens 8<br />
1 Centre for Magnetic Resonance, University of Queensland, Brisbane, Qld, Australia; 2 Queensland Brain Institute, University of<br />
Queensland, Brisbane, Qld, Australia; 3 Curtin University, Perth, WA, Australia; 4 Florey Neuroscience Institutes, Melbourne, Vic,<br />
Australia; 5 Monash University, Melbourne, Vic, Australia; 6 Centre for Magnetic Resonance, University of Queensland, Brisbane,,<br />
Qld, Australia; 7 Prince of Wales Medical Research Institute, Sydney, NSW, Australia; 8 Centre for Advanced Imaging, University of<br />
Queensland, Brisbane, Qld, Australia<br />
When working with mouse brain models it becomes apparent, that anatomically detailed, three dimensional atlases are not readily available. On one hand,<br />
histological atlases are two dimensional, whereas three dimensional MRI atlases might only define 40 brain structures.<br />
Our aim is to create an digital atlas using high resolution images produced by a 16.4 T MRI scanner, complemented by histological data. A higher grade of<br />
segmentation, for example 45 structures in the cerebellum and 35 in the hippocampus, will enable the researcher to compare normal mouse brain anatomy to<br />
pathological anatomical changes in models of disease.<br />
3141. Developmental Changes in the Shape of Hippocampus in Children Aged from 6 to 9 Years Old<br />
Muqing Lin 1 , Lutfi Tugan Muftuler 1 , Ke Nie 1 , Kevin Head 1 , Claudia Buss 2 , Elysia Poggi Davis 2 , Curt A.<br />
Sandman 2 , Orhan Nalcioglu 1 , Min-Ying Lydia Su 1<br />
1 Tu & Yuen Center for Functional Onco-Imaging, University of California, Irvine, Irvine, CA, United States; 2 Department of<br />
Psychiatry and Human Behavior, University of California, Irvine, Irvine, CA, United States<br />
The shape analysis of hippocampus was commonly applied to evaluate the progression of atrophy pattern in elderly patients, and in this study it was applied<br />
to evaluate the changes in developmental brain in 48 children. The distance from the hippocampal surface to the central line was mapped to a 2D grid for<br />
statistical analysis. The Permutation and t-test was applied to compare two age groups (6-7 vs. 8-9 y/o), and the regression analysis with age was also<br />
performed. Significant differences were found in small areas of CA1 and subiculum; however, overall there is not a strong age dependence.