Numerical Methods Contents - SAM
Numerical Methods Contents - SAM
Numerical Methods Contents - SAM
You also want an ePaper? Increase the reach of your titles
YUMPU automatically turns print PDFs into web optimized ePapers that Google loves.
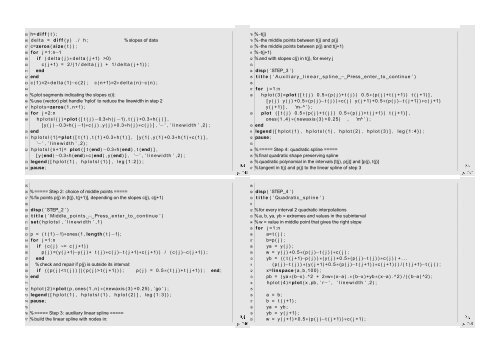
35 h= d i f f ( t ) ;<br />
36 d e l t a = d i f f ( y ) . / h ; % slopes of data<br />
37 c=zeros ( size ( t ) ) ;<br />
38 for j =1:n−1<br />
39 i f ( d e l t a ( j ) ∗ d e l t a ( j +1) >0)<br />
40 c ( j +1) = 2 / ( 1 / d e l t a ( j ) + 1 / d e l t a ( j +1) ) ;<br />
41 end<br />
42 end<br />
43 c ( 1 ) =2∗ d e l t a ( 1 )−c ( 2 ) ; c ( n+1)=2∗ d e l t a ( n )−c ( n ) ;<br />
44<br />
45 % plot segments indicating the slopes c(i):<br />
46 % use (vector) plot handle ’hplot’ to reduce the linewidth in step 2<br />
47 h p l o t s =zeros ( 1 , n+1) ;<br />
48 for j =2:n<br />
49 h p l o t s l ( j ) =plot ( [ t ( j ) −0.3∗h ( j −1) , t ( j ) +0.3∗h ( j ) ] ,<br />
[ y ( j ) −0.3∗h ( j −1)∗c ( j ) , y ( j ) +0.3∗h ( j ) ∗c ( j ) ] , ’− ’ , ’ l i n e w i d t h ’ ,2) ;<br />
50 end<br />
51 h p l o t s l ( 1 ) =plot ( [ t ( 1 ) , t ( 1 ) +0.3∗h ( 1 ) ] , [ y ( 1 ) , y ( 1 ) +0.3∗h ( 1 ) ∗c ( 1 ) ] ,<br />
’− ’ , ’ l i n e w i d t h ’ ,2) ;<br />
52 h p l o t s l ( n+1)= plot ( [ t ( end ) −0.3∗h ( end ) , t ( end ) ] ,<br />
[ y ( end ) −0.3∗h ( end ) ∗c ( end ) , y ( end ) ] , ’− ’ , ’ l i n e w i d t h ’ ,2) ;<br />
53 legend ( [ h p l o t ( 1 ) , h p l o t s l ( 1 ) ] , leg { 1 : 2 } ) ;<br />
Ôº º<br />
Ôº º<br />
54 pause ; 97 % tangent in t(j) and p(j) to the linear spline of step 3<br />
78 % -t(j)<br />
79 % -the middle points between t(j) and p(j)<br />
80 % -the middle points between p(j) and t(j+1)<br />
81 % -t(j+1)<br />
82 % and with slopes c(j) in t(j), for every j<br />
83<br />
84 disp ( ’STEP 3 ’ )<br />
85 t i t l e ( ’ A u x i l i a r y l i n e a r s p l i n e − Press enter to continue ’ )<br />
86<br />
87 for j =1:n<br />
88 h p l o t ( 3 ) =plot ( [ t ( j ) 0.5∗( p ( j ) + t ( j ) ) 0.5∗( p ( j ) + t ( j +1) ) t ( j +1) ] ,<br />
[ y ( j ) y ( j ) +0.5∗(p ( j )−t ( j ) ) ∗c ( j ) y ( j +1) +0.5∗(p ( j )−t ( j +1) ) ∗c ( j +1)<br />
y ( j +1) ] , ’m−^ ’ ) ;<br />
89 plot ( [ t ( j ) 0.5∗( p ( j ) + t ( j ) ) 0.5∗( p ( j ) + t ( j +1) ) t ( j +1) ] ,<br />
ones ( 1 , 4 ) ∗( newaxis ( 3 ) +0.25) , ’m^ ’ ) ;<br />
90 end<br />
91 legend ( [ h p l o t ( 1 ) , h p l o t s l ( 1 ) , h p l o t ( 2 ) , h p l o t ( 3 ) ] , leg { 1 : 4 } ) ;<br />
92 pause ;<br />
93<br />
94 % ===== Step 4: quadratic spline =====<br />
95 % final quadratic shape preserving spline<br />
96 % quadratic polynomial in the intervals [t(j), p(j)] and [p(j), t(j)]<br />
55<br />
56 % ===== Step 2: choice of middle points =====<br />
57 % fix points p(j) in [t(j), t(j+1)], depending on the slopes c(j), c(j+1)<br />
58<br />
59 disp ( ’STEP 2 ’ )<br />
60 t i t l e ( ’ Middle p o i n t s − Press enter to continue ’ )<br />
61 set ( h p l o t s l , ’ l i n e w i d t h ’ ,1)<br />
62<br />
63 p = ( t ( 1 ) −1)∗ones ( 1 , length ( t ) −1) ;<br />
64 for j =1:n<br />
65 i f ( c ( j ) ~= c ( j +1) )<br />
66 p ( j ) =( y ( j +1)−y ( j ) + t ( j ) ∗c ( j )−t ( j +1)∗c ( j +1) ) / ( c ( j )−c ( j +1) ) ;<br />
67 end<br />
68 % check and repair if p(j) is outside its interval:<br />
69 i f ( ( p ( j ) < t ( j ) ) | | ( p ( j ) > t ( j +1) ) ) ; p ( j ) = 0.5∗( t ( j ) + t ( j +1) ) ; end ;<br />
70 end<br />
71<br />
72 h p l o t ( 2 ) =plot ( p , ones ( 1 , n ) ∗( newaxis ( 3 ) +0.25) , ’ go ’ ) ;<br />
73 legend ( [ h p l o t ( 1 ) , h p l o t s l ( 1 ) , h p l o t ( 2 ) ] , leg { 1 : 3 } ) ;<br />
74 pause ;<br />
Ôº º<br />
Ôº º<br />
77 % build the linear spline with nodes in: 120 w = y ( j +1) +0.5∗(p ( j )−t ( j +1) ) ∗c ( j +1) ;<br />
75<br />
76 % ===== Step 3: auxiliary linear spline =====<br />
98<br />
99 disp ( ’STEP 4 ’ )<br />
100 t i t l e ( ’ Quadratic s p l i n e ’ )<br />
101<br />
102 % for every interval 2 quadratic interpolations<br />
103 % a, b, ya, yb = extremes and values in the subinterval<br />
104 % w = value in middle point that gives the right slope<br />
105 for j =1:n<br />
106 a= t ( j ) ;<br />
107 b=p ( j ) ;<br />
108 ya = y ( j ) ;<br />
109 w = y ( j ) +0.5∗(p ( j )−t ( j ) ) ∗c ( j ) ;<br />
110 yb = ( ( t ( j +1)−p ( j ) ) ∗( y ( j ) +0.5∗(p ( j )−t ( j ) ) ∗c ( j ) ) + . . .<br />
111 ( p ( j )−t ( j ) ) ∗( y ( j +1) +0.5∗(p ( j )−t ( j +1) ) ∗c ( j +1) ) ) / ( t ( j +1)−t ( j ) ) ;<br />
112 x=linspace ( a , b ,100) ;<br />
113 pb = ( ya ∗(b−x ) .^2 + 2∗w∗( x−a ) . ∗ ( b−x ) +yb ∗( x−a ) . ^ 2 ) / ( ( b−a ) ^2) ;<br />
114 h p l o t ( 4 ) =plot ( x , pb , ’ r−’ , ’ l i n e w i d t h ’ ,2) ;<br />
115<br />
116 a = b ;<br />
117 b = t ( j +1) ;<br />
118 ya = yb ;<br />
119 yb = y ( j +1) ;


