- Page 1 and 2:
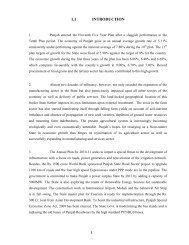
INTRODUCTION 1. The economy of Punj
- Page 3 and 4:
Period/Sector Primary Secondary Ter
- Page 5 and 6:
PER CAPITA INCOME 9. Per capita Inc
- Page 7 and 8:
13. The major fiscal indicators of
- Page 9 and 10:
SN Sector 11 Annual Plan 2008-09 An
- Page 11 and 12:
treated as semi skilled and the val
- Page 13 and 14:
has been successfully banned under
- Page 15 and 16:
opportunities for rural poor in the
- Page 17 and 18:
Government of India. The GoI is now
- Page 19 and 20:
about 37000 acres of additional are
- Page 21 and 22:
management and adoption of informat
- Page 23 and 24:
etween India & Pakistan. Therefore,
- Page 25 and 26:
parks one on 1350 acres at Rajpura
- Page 27 and 28:
2/4/07. The repayment of principal
- Page 29 and 30:
86. There are 3 flying clubs in the
- Page 31 and 32:
o To cover 600 not covered (NC) vil
- Page 33 and 34:
contract basis to DOEACC Chandigarh
- Page 35 and 36:
105. Under BSUP scheme, 320 dwellin
- Page 37 and 38:
112. The Right of Children for Free
- Page 39 and 40:
students. Cook-cum-helper is entitl
- Page 41 and 42:
However, the state government’s c
- Page 43 and 44:
engineering colleges, 33 B. Pharmac
- Page 45 and 46:
treatment in government hospitals.
- Page 47 and 48:
145. One of the oldest Medical Coll
- Page 49 and 50:
schools. Resources permitting, the
- Page 51 and 52:
crore and a sum of Rs. 3324 crore h
- Page 53 and 54:
industry. These institutes have alr
- Page 55 and 56:
175. Maharaja Ranjit Singh Armed Fo
- Page 57 and 58:
efund to exporters and dealers reso
- Page 59 and 60:
CRF. The contribution to the fund i
- Page 61 and 62:
eceives a meager allocation under R
- Page 63 and 64:
Annual Plan 2011-12 SN Component Ou
- Page 65 and 66:
2.1 CROP HUSBANDRY 2. AGRICULTURE A
- Page 67 and 68:
lac as 90% Government of India shar
- Page 69 and 70:
2.1.15 A State Level Training Insti
- Page 71 and 72:
valleys: Assistance for development
- Page 73 and 74:
Government to each of the eligible
- Page 75 and 76:
AGR-11 Strengthening of Marketing I
- Page 77 and 78:
State, improvement in soil fertilit
- Page 79 and 80:
2.1.40 The scheme was admitted with
- Page 81 and 82:
land use, promoting crop diversific
- Page 83 and 84:
organizing fruits/vegetable shows a
- Page 85 and 86:
2008-09. The funding of the scheme
- Page 87 and 88:
CS (AGR)-5 Promotion and strengthen
- Page 89 and 90:
2.2 SOIL AND WATER CONSERVATION 89
- Page 91 and 92:
subsidy at the rate of 50% on horti
- Page 93 and 94:
farmers. The balance 40% on private
- Page 95 and 96:
save 15-25% of water, power & labou
- Page 97 and 98:
In addition, animals frequently suf
- Page 99 and 100:
State Funded Schemes AH-6 Establish
- Page 101 and 102:
140.00 lac was incurred during 2009
- Page 103 and 104:
2.3.30 An expenditure of Rs.25.00 l
- Page 105 and 106:
2.3.40 From the year 2010-11 onward
- Page 107 and 108:
CS(AH)-2 Assistance to States for I
- Page 109 and 110:
2.3.58 An outlay of Rs. 91.00 lac i
- Page 111 and 112:
CS (AH)-19 National Control Program
- Page 113 and 114:
(v) Strengthening infrastructure fo
- Page 115 and 116:
contract basis/outsourcing is requi
- Page 117 and 118:
To overcome these problems, it is p
- Page 119 and 120:
hectare for all farmers except SCs/
- Page 121 and 122:
and water logged/Brackish water are
- Page 123 and 124:
support, institutional support, tra
- Page 125 and 126:
system to an acceptable level of he
- Page 127 and 128:
2.8.20 An outlay of Rs.1000.00 lac
- Page 129 and 130:
3. RURAL DEVELOPMENT 129 Outlay - R
- Page 131 and 132:
subsidy. It is a holistic programme
- Page 133 and 134:
no expenditure could be incurred. A
- Page 135 and 136:
(vii) Encouraging village community
- Page 137 and 138:
year Perspective Plan under BRGF on
- Page 139 and 140:
during 2007-08. All the districts o
- Page 141 and 142:
3.25 Government of India was provid
- Page 143 and 144:
equired to implement this scheme in
- Page 145 and 146:
made for this scheme in the Annual
- Page 147 and 148:
RDO(S)-11 Construction of new build
- Page 149 and 150:
individual families in the rural ar
- Page 151 and 152:
commercial buildings etc. which wil
- Page 153 and 154:
Basic indicators (Rural Development
- Page 155 and 156:
4. NRI AFFAIRS 155 Outlay - Rs. 500
- Page 157 and 158:
The sharing pattern of this scheme
- Page 159 and 160:
2010-11, however the project could
- Page 161 and 162:
Rs. 88 lac. An expenditure of Rs. 2
- Page 163 and 164:
State Funded Schemes IR-11 Completi
- Page 165 and 166:
MI-3 Construction of Low Dams in Ka
- Page 167 and 168:
MI - 9 Rehabilitation of Sidhwan Br
- Page 169 and 170:
State Funded Schemes MI-12 Remodeli
- Page 171 and 172:
expenditure of Rs. 12385.23 lac was
- Page 173 and 174:
CAD-5 Construction of Field Channel
- Page 175 and 176:
and Gurdaspur with approximate cost
- Page 177 and 178:
ha of waterlogged area falling in e
- Page 179 and 180:
FC -9 Construction of Bridges on Ri
- Page 181 and 182:
CS (FC)-2 Construction of Flood Pro
- Page 183 and 184:
(8) Augmenting and strengthening of
- Page 185 and 186:
127000.00 lac. Targets for 11 th Fi
- Page 187 and 188:
(ii) Rajiv Gandhi Gramin Vidyutikar
- Page 189 and 190:
certain renovation and modernizatio
- Page 191 and 192:
(viii) Renovation and Modernization
- Page 193 and 194:
Expenditure incurred during the yea
- Page 195 and 196:
PEDA / PGL share - Rs. 3.00 crore S
- Page 197 and 198:
NC- 2 Mini/Micro Hydel Projects 197
- Page 199 and 200:
the cost of SPV pumps is still high
- Page 201 and 202:
SN Item Position during Position du
- Page 203 and 204:
against the expenditure of Rs. 2500
- Page 205 and 206:
New Schemes VSI-12 Implementation o
- Page 207 and 208:
Rs. 105 crore which comes to Rs. 21
- Page 209 and 210:
8.1 ROAD TRANSPORT 8. TRANSPORT 209
- Page 211 and 212:
New Scheme State Funded Scheme RT-8
- Page 213 and 214:
contributed by NABARD through RIDF
- Page 215 and 216:
RB-6 (ii) State Share for upgradati
- Page 217 and 218:
The state government has given focu
- Page 219 and 220:
of 2% on agricultural produce excep
- Page 221 and 222:
Sr. No. MAJOR EPC INFRASTRUCTURE PR
- Page 223 and 224:
Sr. No. 25 26 27 28 29 30 31 32 MAJ
- Page 225 and 226:
Sr. No. MAJOR EPC INFRASTRUCTURE PR
- Page 227 and 228:
Sr. No. MAJOR EPC INFRASTRUCTURE PR
- Page 229 and 230:
Sr. No. MAJOR EPC INFRASTRUCTURE PR
- Page 231 and 232:
Sr. No. 41 42 43 44 1 2 3 4 5 6 7 M
- Page 233 and 234:
Sr. No. 1 2 3 4 5 6 7 8 9 10 11 11
- Page 235 and 236:
Sr. No. MAJOR EPC INFRASTRUCTURE PR
- Page 237 and 238:
Sr. No. 1 MAJOR EPC INFRASTRUCTURE
- Page 239 and 240:
Sr. No. MAJOR EPC INFRASTRUCTURE PR
- Page 241 and 242:
9. SCIENCE, TECHNOLOGY AND ENVIRONM
- Page 243 and 244:
eleased Rs. 513.41 lac and state go
- Page 245 and 246:
9.1.16 An expenditure of Rs. 5.17 l
- Page 247 and 248:
9.1.27 Under this scheme no expendi
- Page 249 and 250:
the departments will be able to spe
- Page 251 and 252:
ADDITIONAL CENTRAL ASSISTANCE (100%
- Page 253 and 254:
Annexure-‘A’ List of Plan Schem
- Page 255 and 256:
SN Name of Sub-head/Scheme 2010-11
- Page 257 and 258:
expenditure was incurred during 200
- Page 259 and 260:
ecycled into the process of nearby
- Page 261 and 262:
hundred years old. It is also known
- Page 263 and 264:
The ground water reserve of the sta
- Page 265 and 266:
500.00 lac is provided in the 11th
- Page 267 and 268:
is given as under:- SN PARTICULARS
- Page 269 and 270:
scheme during 2009-10. The scheme a
- Page 271 and 272:
State funded schemes FT-10 Punjab F
- Page 273 and 274:
for capacity building and fieldwork
- Page 275 and 276:
New Schemes FT-22 Purchase of Land
- Page 277 and 278:
10. GENERAL ECONOMIC SERVICES 10.1
- Page 279 and 280:
PM-2 Strengthening of Planning Mach
- Page 281 and 282:
PM-7 Grant- in- aid to IDC for Rese
- Page 283 and 284:
PM-12 Schemes for Special Area Prog
- Page 285 and 286:
an amount of Rs.4.32 crore for Punj
- Page 287 and 288:
incurred. An amount of Rs. 1.00 lac
- Page 289 and 290:
100% Centrally Sponsored Schemes CS
- Page 291 and 292:
implementation which is estimated t
- Page 293 and 294:
eleased by Government of India. (80
- Page 295 and 296:
documents and other office expenses
- Page 297 and 298:
TM-7 Touch Screen Kiosk (50:50) 297
- Page 299 and 300:
ii) To commensurate an important hi
- Page 301 and 302:
four years starting from 2009-10 to
- Page 303 and 304:
the responsibility of the Legal Met
- Page 305 and 306:
fertility and irrigation facilities
- Page 307 and 308:
Convergence of Schemes 10.5.10 Util
- Page 309 and 310:
(v) Construction of common shelters
- Page 311 and 312:
modalities of execution of schemes
- Page 313 and 314:
Release of Funds 10.5.25 As per the
- Page 315 and 316:
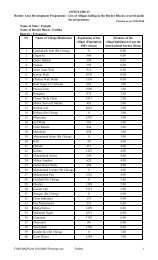
Progress under BADP during 2006-07
- Page 317 and 318:
Progress under BADP during 2010-11
- Page 319 and 320:
Let (i) Total Populaton = P1, Popul
- Page 321 and 322:
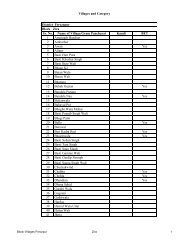
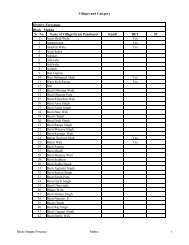
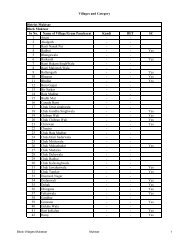
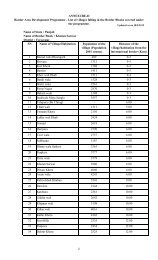
SN Name of the District/ Block Popu
- Page 323 and 324:
Level Primary Elementary Upper Prim
- Page 325 and 326: elementary education i.e. Class - V
- Page 327 and 328: 11.1.14 An outlay of Rs. 43158.02 l
- Page 329 and 330: * Includes 1.99 lac students under
- Page 331 and 332: schooling, an opportunity to comple
- Page 333 and 334: 11.1.29 Under this scheme, preparat
- Page 335 and 336: Approximately, Rs. 65.00 crore to R
- Page 337 and 338: expenditure of Rs. 140.38 lac was i
- Page 339 and 340: However, no expenditure was incurre
- Page 341 and 342: Higher Education On going Schemes C
- Page 343 and 344: expenditure. In view of this, an ou
- Page 345 and 346: HE-17 Establishment of World Class
- Page 347 and 348: 2009- 10, however, no expenditure w
- Page 349 and 350: of World Classics in Punjabi and re
- Page 351 and 352: On Going Schemes Centrally Sponsore
- Page 353 and 354: State Project Facilitation Unit. An
- Page 355 and 356: TE -5 Upgradation of 18 Government
- Page 357 and 358: 11.3 SPORTS AND YOUTH SERVICES 357
- Page 359 and 360: YS-4 Establishment of State Youth T
- Page 361 and 362: 10 th Five Year Plan. An outlay of
- Page 363 and 364: SPORTS On Going Schemes Centrally S
- Page 365 and 366: incurred in the Annual Plan 2010-11
- Page 367 and 368: 11.4 ART AND CULTURE Outlay - Rs. 1
- Page 369 and 370: AC-3 Holding of Musical and Cultura
- Page 371 and 372: Archives Ongoing Schemes Centrally
- Page 373 and 374: espectively. An outlay of Rs. 10.00
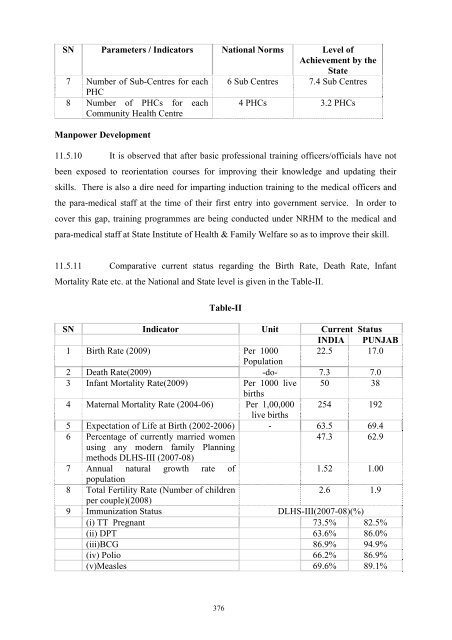
- Page 375: Primary Healthcare system. Since, C
- Page 379 and 380: DRME-2(a) Upgradation of infrastruc
- Page 381 and 382: Nursing students(College of Nursing
- Page 383 and 384: 11.5.36 A new scheme DRME-10 “Con
- Page 385 and 386: 11.5.45 An outlay of Rs. 100.00 lac
- Page 387 and 388: (3) Prevention and control of commu
- Page 389 and 390: 11.5.61 Under the scheme, all the p
- Page 391 and 392: heavy metals in water and indiscrim
- Page 393 and 394: Nagar(Nawan Shehar) were created. B
- Page 395 and 396: DHS 32 Strengthening of fire safety
- Page 397 and 398: CS-35 National Tobacco Control Prog
- Page 399 and 400: population. This scheme is meant to
- Page 401 and 402: incurred. An outlay of Rs. 829.62 l
- Page 403 and 404: 11.5.113 An outlay of Rs. 50.00 lac
- Page 405 and 406: the state government. Salaries of t
- Page 407 and 408: Centrally Sponsored/Funded Schemes
- Page 409 and 410: 11.6 WATER SUPPLY AND SANITATION A.
- Page 411 and 412: India shall provide grant to the tu
- Page 413 and 414: UWS- 6 (ii) Setting up of Sewerage
- Page 415 and 416: works at Patti. An amount of Rs. 89
- Page 417 and 418: the state government has approved p
- Page 419 and 420: 100% Centrally Sponsored Schemes CS
- Page 421 and 422: water supply has been provided in 1
- Page 423 and 424: RWS-4 Punjab Rural Water Supply and
- Page 425 and 426: from Rs. 1500 to Rs. 2500. The ince
- Page 427 and 428:
Ludhiana Moga and Bathinda are alre
- Page 429 and 430:
RWS-14 Water Supply & Sewerage Faci
- Page 431 and 432:
funds 20% funds are utilized for AW
- Page 433 and 434:
The state government has installed
- Page 435 and 436:
Rs. 150.00 crore. Government of Ind
- Page 437 and 438:
UD-9 Strengthening of Fire and Emer
- Page 439 and 440:
UD-8 Integrated Low Cost Sanitation
- Page 441 and 442:
UD-10 Development Works at Moga 441
- Page 443 and 444:
2009-10. However, a token provision
- Page 445 and 446:
08, 2008-09 and 2009-10 respectivel
- Page 447 and 448:
IP-8 Purchase of Books for library
- Page 449 and 450:
disciplines for the pre production
- Page 451 and 452:
SN Name of the Scheme 11 th Five ye
- Page 453 and 454:
Education Ongoing Schemes Centrally
- Page 455 and 456:
of Rs. 100.00 lac was provided for
- Page 457 and 458:
each was provided for 2008-09, 2009
- Page 459 and 460:
Other Programmes for SCs Ongoing Sc
- Page 461 and 462:
(iv) This benefit is limited upto t
- Page 463 and 464:
corporation would be able to raise
- Page 465 and 466:
Rate of scholarships will be as und
- Page 467 and 468:
However, funds for the construction
- Page 469 and 470:
CS(SC)-8 Babu Jagjivan Ram Chhatraw
- Page 471 and 472:
community so as to provide them bet
- Page 473 and 474:
Sr.No. Sub-head/Name of the Scheme
- Page 475 and 476:
100.00 lac was provided during 2009
- Page 477 and 478:
SWD (S)-3 Information and Technolog
- Page 479 and 480:
Social Security Ongoing Scheme Stat
- Page 481 and 482:
(b) Accidental death Rs. 75,000/- (
- Page 483 and 484:
11.11.22 The name of the scheme has
- Page 485 and 486:
11.12 WOMEN AND CHILD DEVELOPMENT 4
- Page 487 and 488:
Direction & Administration Child Pr
- Page 489 and 490:
scheme. An outlay of Rs. 1000.00 la
- Page 491 and 492:
was provided but no expenditure cou
- Page 493 and 494:
11 but no expenditure could be incu
- Page 495 and 496:
11 th Five Year Plan. An expenditur
- Page 497 and 498:
(ii) Encouraging the women to follo
- Page 499 and 500:
districts where ‘SABLA’ has bee
- Page 501 and 502:
SN Sub-head/Name of the Scheme Appr
- Page 503 and 504:
LW-3 Creation of Labour Courts at L
- Page 505 and 506:
State Funded Schemes EG-1 Skill Dev
- Page 507 and 508:
o Security Services Related Trainin
- Page 509 and 510:
EG-3 Maharaja Ranjit Singh Armed Fo
- Page 511 and 512:
On Going Schemes Centrally Sponsore
- Page 513 and 514:
provided in the 11 th Five Year Pla
- Page 515 and 516:
ITI-10 Leather goods training centr
- Page 517 and 518:
migration of rural youth to the urb
- Page 519 and 520:
11.16.2 In order to achieve these o
- Page 521 and 522:
DSW 5 Grant-in-aid to Para-plegic R
- Page 523 and 524:
DSW-11 Construction of National Sai
- Page 525 and 526:
of Rs. 0.10 lac was provided in the
- Page 527 and 528:
officers of Punjab, Haryana and U.T
- Page 529 and 530:
12.2.12 Under this system, Police C
- Page 531 and 532:
o Purchase of Hardware o Interconne
- Page 533 and 534:
HAJ- 13 Revamping of Civil Defence
- Page 535 and 536:
HP-2 Renovation of Punjab Bhawan, N
- Page 537 and 538:
allocation. Therefore, Government w
- Page 539 and 540:
conferencing in the department in a
- Page 541 and 542:
Works to be taken up Construction o
- Page 543 and 544:
of Records of Rights(ROR) and other
- Page 545 and 546:
12.9.14 The Ministry of Finance, GO
- Page 547 and 548:
13. EMPLOYMENT 13.1 The magnitude o
- Page 549 and 550:
o Enhancing the employability of Yo
- Page 551 and 552:
o Retail centre - Set up in Amritsa
- Page 553 and 554:
incurred during 2010-11 respectivel
- Page 555 and 556:
others Under this scheme a rural ho
- Page 557 and 558:
student from class +1 and +2 is cha
- Page 559 and 560:
in Februrary,2011 and all employed.
- Page 561 and 562:
and NSKFDC in collaboration with NS
- Page 563 and 564:
CAL-C, CEDTI and other reputed inst
- Page 565 and 566:
against the expenditure of Rs. 2500
- Page 567 and 568:
and 11-Radiography every year. Raji
- Page 569 and 570:
14. EXTERNALLY AIDED PROJECTS An ou
- Page 571 and 572:
of the project is to improve the in
- Page 573 and 574:
during 2009-10. During 2010-11, 221
- Page 575 and 576:
79564 hactare area was treated thro
- Page 577 and 578:
Status of Constitution of District
- Page 579 and 580:
(3) Any member of the Committee inc
- Page 581 and 582:
Preparation of District Development
- Page 583 and 584:
Statistics for the implementation o
- Page 585 and 586:
15.21 Out of these funds, 1% funds
- Page 587 and 588:
Code No. Sub-Head/Name of the Schem
- Page 589 and 590:
Code No. Sub-Head/Name of the Schem
- Page 591 and 592:
quorum, will be brought before and
- Page 593 and 594:
Illustrative list of works which ca
- Page 595 and 596:
16. ROLE OF NGOS IN THE DEVELOPMENT
- Page 597:
(3) To facilitate developing self r