SIREC D Display Recorder 7ND4000
SIREC D Display Recorder 7ND4000
SIREC D Display Recorder 7ND4000

Erfolgreiche ePaper selbst erstellen
Machen Sie aus Ihren PDF Publikationen ein blätterbares Flipbook mit unserer einzigartigen Google optimierten e-Paper Software.
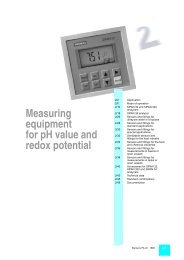
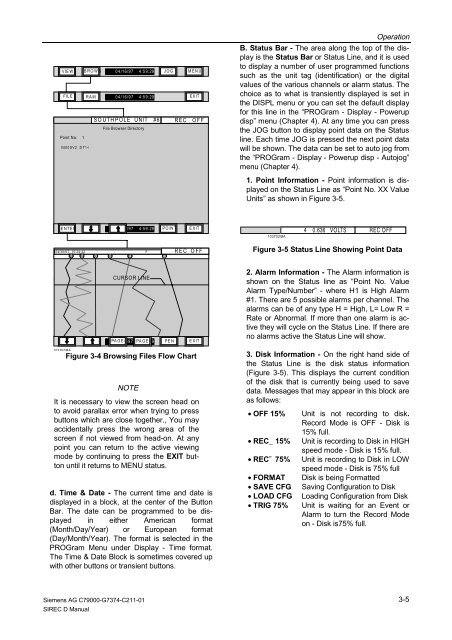
VIEW BROWS 04/16/97 4:59:29 JOG MENU<br />
10370 0MA<br />
FILE RAM 04/16/97 4:59:29 EXIT<br />
Point No: 1<br />
0000SV2 .DT1<<br />
SOUTHPOLE UNIT #6 REC OFF<br />
File Browser Directory<br />
ENTER 04/16/97 4:59:29 PO INT EXIT<br />
04/30/9 7 15:24:42 : F REC OFF<br />
1 2 3 4<br />
5 6<br />
CURSOR LINE<br />
CURSOR LINE<br />
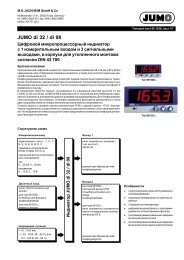
NOTE<br />
It is necessary to view the screen head on<br />
to avoid parallax error when trying to press<br />
buttons which are close together., You may<br />
accidentally press the wrong area of the<br />
screen if not viewed from head-on. At any<br />
point you can return to the active viewing<br />
mode by continuing to press the EXIT button<br />
until it returns to MENU status.<br />
d. Time & Date - The current time and date is<br />
displayed in a block, at the center of the Button<br />
Bar. The date can be programmed to be displayed<br />
in either American format<br />
(Month/Day/Year) or European format<br />
(Day/Month/Year). The format is selected in the<br />
PROGram Menu under <strong>Display</strong> - Time format.<br />
The Time & Date Block is sometimes covered up<br />
with other buttons or transient buttons.<br />
Siemens AG C79000-G7374-C211-01<br />
<strong>SIREC</strong> D Manual<br />
PA04/16/97 G E - PA 4:59:29 G E + PE N E XIT<br />
Figure 3-4 Browsing Files Flow Chart<br />
Operation<br />
B. Status Bar - The area along the top of the display<br />
is the Status Bar or Status Line, and it is used<br />
to display a number of user programmed functions<br />
such as the unit tag (identification) or the digital<br />
values of the various channels or alarm status. The<br />
choice as to what is transiently displayed is set in<br />
the DISPL menu or you can set the default display<br />
for this line in the “PROGram - <strong>Display</strong> - Powerup<br />
disp” menu (Chapter 4). At any time you can press<br />
the JOG button to display point data on the Status<br />
line. Each time JOG is pressed the next point data<br />
will be shown. The data can be set to auto jog from<br />
the “PROGram - <strong>Display</strong> - Powerup disp - Autojog”<br />
menu (Chapter 4).<br />
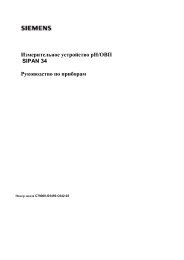
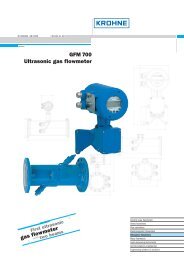
1. Point Information - Point information is displayed<br />
on the Status Line as “Point No. XX Value<br />
Units” as shown in Figure 3-5.<br />
103702MA<br />
4 0.636 VO LTS REC O FF<br />
Figure 3-5 Status Line Showing Point Data<br />
2. Alarm Information - The Alarm information is<br />
shown on the Status line as “Point No. Value<br />
Alarm Type/Number” - where H1 is High Alarm<br />
#1. There are 5 possible alarms per channel. The<br />
alarms can be of any type H = High, L= Low R =<br />
Rate or Abnormal. If more than one alarm is active<br />
they will cycle on the Status Line. If there are<br />
no alarms active the Status Line will show.<br />
3. Disk Information - On the right hand side of<br />
the Status Line is the disk status information<br />
(Figure 3-5). This displays the current condition<br />
of the disk that is currently being used to save<br />
data. Messages that may appear in this block are<br />
as follows:<br />
• OFF 15% Unit is not recording to disk.<br />
Record Mode is OFF - Disk is<br />
15% full.<br />
• REC_ 15% Unit is recording to Disk in HIGH<br />
speed mode - Disk is 15% full.<br />
• REC¯ 75% Unit is recording to Disk in LOW<br />
speed mode - Disk is 75% full<br />
• FORMAT Disk is being Formatted<br />
• SAVE CFG Saving Configuration to Disk<br />
• LOAD CFG Loading Configuration from Disk<br />
• TRIG 75% Unit is waiting for an Event or<br />
Alarm to turn the Record Mode<br />
on - Disk is75% full.<br />
3-5