SIREC D Display Recorder 7ND4000
SIREC D Display Recorder 7ND4000
SIREC D Display Recorder 7ND4000

Sie wollen auch ein ePaper? Erhöhen Sie die Reichweite Ihrer Titel.
YUMPU macht aus Druck-PDFs automatisch weboptimierte ePaper, die Google liebt.
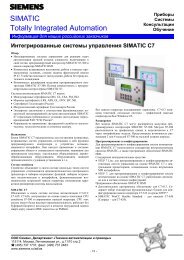
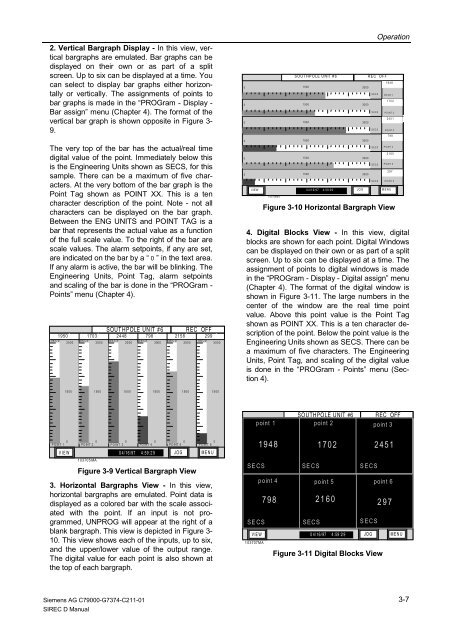
2. Vertical Bargraph <strong>Display</strong> - In this view, vertical<br />
bargraphs are emulated. Bar graphs can be<br />
displayed on their own or as part of a split<br />
screen. Up to six can be displayed at a time. You<br />
can select to display bar graphs either horizontally<br />
or vertically. The assignments of points to<br />
bar graphs is made in the “PROGram - <strong>Display</strong> -<br />
Bar assign” menu (Chapter 4). The format of the<br />
vertical bar graph is shown opposite in Figure 3-<br />
9.<br />
The very top of the bar has the actual/real time<br />
digital value of the point. Immediately below this<br />
is the Engineering Units shown as SECS, for this<br />
sample. There can be a maximum of five characters.<br />
At the very bottom of the bar graph is the<br />
Point Tag shown as POINT XX. This is a ten<br />
character description of the point. Note - not all<br />
characters can be displayed on the bar graph.<br />
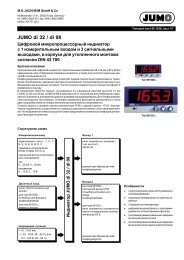
Between the ENG UNITS and POINT TAG is a<br />
bar that represents the actual value as a function<br />
of the full scale value. To the right of the bar are<br />
scale values. The alarm setpoints, if any are set,<br />
are indicated on the bar by a “ 0 ” in the text area.<br />
If any alarm is active, the bar will be blinking. The<br />
Engineering Units, Point Tag, alarm setpoints<br />
and scaling of the bar is done in the “PROGram -<br />
Points” menu (Chapter 4).<br />
19501<br />
SE C S<br />
3000<br />
1500<br />
0<br />
POINT 1<br />
2 17031<br />
SECS<br />
3000<br />
1500<br />
0<br />
POINT 2<br />
V I E W 0 4/ 16 /97 4 :59 :2 9 J O G M E N U<br />
103705MA<br />
3. Horizontal Bargraphs View - In this view,<br />
horizontal bargraphs are emulated. Point data is<br />
displayed as a colored bar with the scale associated<br />
with the point. If an input is not programmed,<br />
UNPROG will appear at the right of a<br />
blank bargraph. This view is depicted in Figure 3-<br />
10. This view shows each of the inputs, up to six,<br />
and the upper/lower value of the output range.<br />
The digital value for each point is also shown at<br />
the top of each bargraph.<br />
Siemens AG C79000-G7374-C211-01<br />
<strong>SIREC</strong> D Manual<br />
SOUT HPOLE UNIT #6 REC OFF<br />
24481<br />
SECS<br />
3000<br />
1500<br />
0<br />
POINT 3<br />
798 1<br />
SECS<br />
3000<br />
1500<br />
0<br />
POINT 4<br />
21581<br />
SE C S<br />
3000<br />
1500<br />
0<br />
POINT 5<br />
Figure 3-9 Vertical Bargraph View<br />
299 1<br />
SECS<br />
3000<br />
1500<br />
0<br />
POINT 6<br />
SOUTHPOLE UNIT #6 REC OFF<br />
0 1500 3000<br />
0 1500 3000<br />
0 1500 3000<br />
0 1500 3000<br />
0 1500 3000<br />
0 1500 3000<br />
VIEW 04/16/97 4:59:29 JOG M EN U<br />
103 706MA<br />
0<br />
Operation<br />
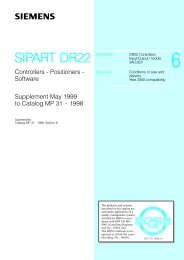
4. Digital Blocks View - In this view, digital<br />
blocks are shown for each point. Digital Windows<br />
can be displayed on their own or as part of a split<br />
screen. Up to six can be displayed at a time. The<br />
assignment of points to digital windows is made<br />
in the “PROGram - <strong>Display</strong> - Digital assign” menu<br />
(Chapter 4). The format of the digital window is<br />
shown in Figure 3-11. The large numbers in the<br />
center of the window are the real time point<br />
value. Above this point value is the Point Tag<br />
shown as POINT XX. This is a ten character description<br />
of the point. Below the point value is the<br />
Engineering Units shown as SECS. There can be<br />
a maximum of five characters. The Engineering<br />
Units, Point Tag, and scaling of the digital value<br />
is done in the “PROGram - Points” menu (Section<br />
4).<br />
SECS<br />
SECS<br />
SECS<br />
SECS<br />
SECS<br />
SECS<br />
1948<br />
PO INT 1<br />
1702<br />
POINT 2<br />
2451<br />
PO INT 3<br />
798<br />
POINT 4<br />
2160<br />
POINT 5<br />
POINT 6<br />
Figure 3-10 Horizontal Bargraph View<br />
SOUTHPOLE UNIT #6 REC OFF<br />
point 1 point 2 point 3<br />
SECS<br />
VIEW 04/16/97 4:59:29 JOG MENU<br />
103707MA<br />
1948 1702 2451<br />
SECS<br />
SECS<br />
point 4 point 5 point 6<br />
798 2160 297<br />
SECS SECS SECS<br />
Figure 3-11 Digital Blocks View<br />
297<br />
2<br />
3-7