SIREC D Display Recorder 7ND4000
SIREC D Display Recorder 7ND4000
SIREC D Display Recorder 7ND4000

Sie wollen auch ein ePaper? Erhöhen Sie die Reichweite Ihrer Titel.
YUMPU macht aus Druck-PDFs automatisch weboptimierte ePaper, die Google liebt.
Programming<br />
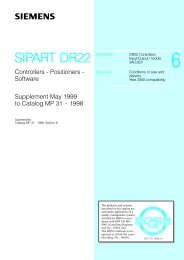
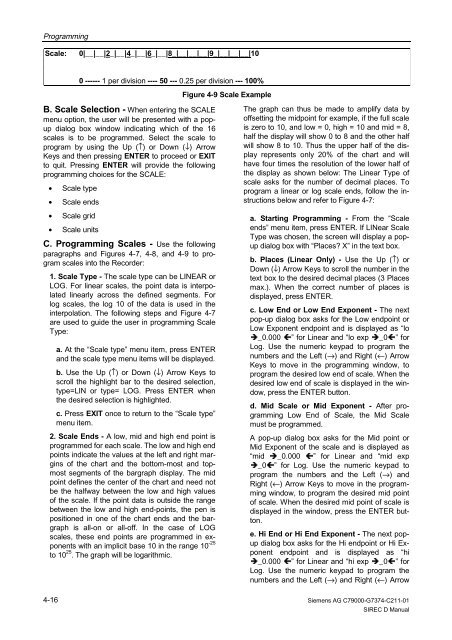
Scale: 0|__|__|2_|__|4_|__|6_|__|8_|__|__|__|9_|__|__|__|10<br />
B. Scale Selection - When entering the SCALE<br />
menu option, the user will be presented with a popup<br />
dialog box window indicating which of the 16<br />
scales is to be programmed. Select the scale to<br />
program by using the Up (↑) or Down (↓) Arrow<br />
Keys and then pressing ENTER to proceed or EXIT<br />
to quit. Pressing ENTER will provide the following<br />
programming choices for the SCALE:<br />
• Scale type<br />
• Scale ends<br />
• Scale grid<br />
• Scale units<br />
C. Programming Scales - Use the following<br />
paragraphs and Figures 4-7, 4-8, and 4-9 to program<br />
scales into the <strong>Recorder</strong>:<br />
1. Scale Type - The scale type can be LINEAR or<br />
LOG. For linear scales, the point data is interpolated<br />
linearly across the defined segments. For<br />
log scales, the log 10 of the data is used in the<br />
interpolation. The following steps and Figure 4-7<br />
are used to guide the user in programming Scale<br />
Type:<br />
4-16<br />
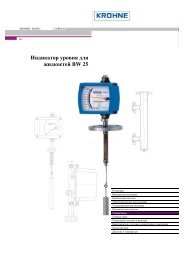
0 ------ 1 per division ---- 50 --- 0.25 per division --- 100%<br />
a. At the “Scale type” menu item, press ENTER<br />
and the scale type menu items will be displayed.<br />
b. Use the Up (↑) or Down (↓) Arrow Keys to<br />
scroll the highlight bar to the desired selection,<br />
type=LIN or type= LOG. Press ENTER when<br />
the desired selection is highlighted.<br />
c. Press EXIT once to return to the “Scale type”<br />
menu item.<br />
2. Scale Ends - A low, mid and high end point is<br />
programmed for each scale. The low and high end<br />
points indicate the values at the left and right margins<br />
of the chart and the bottom-most and topmost<br />
segments of the bargraph display. The mid<br />
point defines the center of the chart and need not<br />
be the halfway between the low and high values<br />
of the scale. If the point data is outside the range<br />
between the low and high end-points, the pen is<br />
positioned in one of the chart ends and the bargraph<br />
is all-on or all-off. In the case of LOG<br />
scales, these end points are programmed in exponents<br />
with an implicit base 10 in the range 10 -25<br />
to 10 25 . The graph will be logarithmic.<br />
Figure 4-9 Scale Example<br />
The graph can thus be made to amplify data by<br />
offsetting the midpoint for example, if the full scale<br />
is zero to 10, and low = 0, high = 10 and mid = 8,<br />
half the display will show 0 to 8 and the other half<br />
will show 8 to 10. Thus the upper half of the display<br />
represents only 20% of the chart and will<br />
have four times the resolution of the lower half of<br />
the display as shown below: The Linear Type of<br />
scale asks for the number of decimal places. To<br />
program a linear or log scale ends, follow the instructions<br />
below and refer to Figure 4-7:<br />
a. Starting Programming - From the “Scale<br />
ends” menu item, press ENTER. If LINear Scale<br />
Type was chosen, the screen will display a popup<br />
dialog box with “Places? X” in the text box.<br />
b. Places (Linear Only) - Use the Up (↑) or<br />
Down (↓) Arrow Keys to scroll the number in the<br />
text box to the desired decimal places (3 Places<br />
max.). When the correct number of places is<br />
displayed, press ENTER.<br />
c. Low End or Low End Exponent - The next<br />
pop-up dialog box asks for the Low endpoint or<br />
Low Exponent endpoint and is displayed as “lo<br />
�_0.000 �” for Linear and “lo exp �_0�” for<br />
Log. Use the numeric keypad to program the<br />
numbers and the Left (→) and Right (←) Arrow<br />
Keys to move in the programming window, to<br />
program the desired low end of scale. When the<br />
desired low end of scale is displayed in the window,<br />
press the ENTER button.<br />
d. Mid Scale or Mid Exponent - After programming<br />
Low End of Scale, the Mid Scale<br />
must be programmed.<br />
A pop-up dialog box asks for the Mid point or<br />
Mid Exponent of the scale and is displayed as<br />
“mid �_0.000 �” for Linear and “mid exp<br />
�_0�” for Log. Use the numeric keypad to<br />
program the numbers and the Left (→) and<br />
Right (←) Arrow Keys to move in the programming<br />
window, to program the desired mid point<br />
of scale. When the desired mid point of scale is<br />
displayed in the window, press the ENTER button.<br />
e. Hi End or Hi End Exponent - The next popup<br />
dialog box asks for the Hi endpoint or Hi Exponent<br />
endpoint and is displayed as “hi<br />
�_0.000 �” for Linear and “hi exp �_0�” for<br />
Log. Use the numeric keypad to program the<br />
numbers and the Left (→) and Right (←) Arrow<br />
Siemens AG C79000-G7374-C211-01<br />
<strong>SIREC</strong> D Manual