SIREC D Display Recorder 7ND4000
SIREC D Display Recorder 7ND4000
SIREC D Display Recorder 7ND4000
Sie wollen auch ein ePaper? Erhöhen Sie die Reichweite Ihrer Titel.
YUMPU macht aus Druck-PDFs automatisch weboptimierte ePaper, die Google liebt.
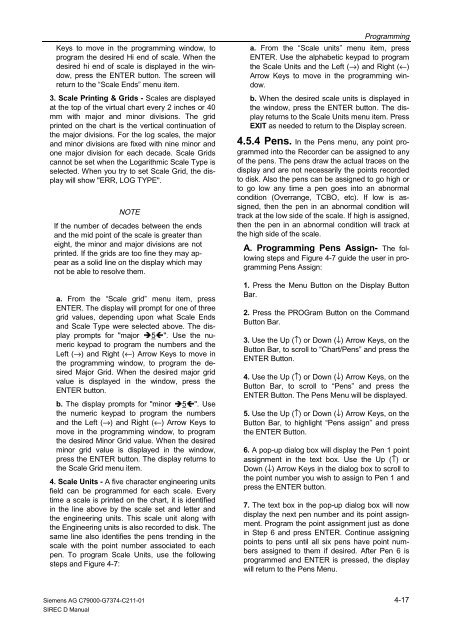
Keys to move in the programming window, to<br />
program the desired Hi end of scale. When the<br />
desired hi end of scale is displayed in the window,<br />
press the ENTER button. The screen will<br />
return to the “Scale Ends” menu item.<br />
3. Scale Printing & Grids - Scales are displayed<br />
at the top of the virtual chart every 2 inches or 40<br />
mm with major and minor divisions. The grid<br />
printed on the chart is the vertical continuation of<br />
the major divisions. For the log scales, the major<br />
and minor divisions are fixed with nine minor and<br />
one major division for each decade. Scale Grids<br />
cannot be set when the Logarithmic Scale Type is<br />
selected. When you try to set Scale Grid, the display<br />
will show "ERR, LOG TYPE".<br />
NOTE<br />
If the number of decades between the ends<br />
and the mid point of the scale is greater than<br />
eight, the minor and major divisions are not<br />
printed. If the grids are too fine they may appear<br />
as a solid line on the display which may<br />
not be able to resolve them.<br />
a. From the “Scale grid” menu item, press<br />
ENTER. The display will prompt for one of three<br />
grid values, depending upon what Scale Ends<br />
and Scale Type were selected above. The display<br />
prompts for "major �5�". Use the numeric<br />
keypad to program the numbers and the<br />
Left (→) and Right (←) Arrow Keys to move in<br />
the programming window, to program the desired<br />
Major Grid. When the desired major grid<br />
value is displayed in the window, press the<br />
ENTER button.<br />
b. The display prompts for "minor �5�". Use<br />
the numeric keypad to program the numbers<br />
and the Left (→) and Right (←) Arrow Keys to<br />
move in the programming window, to program<br />
the desired Minor Grid value. When the desired<br />
minor grid value is displayed in the window,<br />
press the ENTER button. The display returns to<br />
the Scale Grid menu item.<br />
4. Scale Units - A five character engineering units<br />
field can be programmed for each scale. Every<br />
time a scale is printed on the chart, it is identified<br />
in the line above by the scale set and letter and<br />
the engineering units. This scale unit along with<br />
the Engineering units is also recorded to disk. The<br />
same line also identifies the pens trending in the<br />
scale with the point number associated to each<br />
pen. To program Scale Units, use the following<br />
steps and Figure 4-7:<br />
Siemens AG C79000-G7374-C211-01<br />
<strong>SIREC</strong> D Manual<br />
Programming<br />
a. From the “Scale units” menu item, press<br />
ENTER. Use the alphabetic keypad to program<br />
the Scale Units and the Left (→) and Right (←)<br />
Arrow Keys to move in the programming window.<br />
b. When the desired scale units is displayed in<br />
the window, press the ENTER button. The display<br />
returns to the Scale Units menu item. Press<br />
EXIT as needed to return to the <strong>Display</strong> screen.<br />
4.5.4 Pens. In the Pens menu, any point programmed<br />
into the <strong>Recorder</strong> can be assigned to any<br />
of the pens. The pens draw the actual traces on the<br />
display and are not necessarily the points recorded<br />
to disk. Also the pens can be assigned to go high or<br />
to go low any time a pen goes into an abnormal<br />
condition (Overrange, TCBO, etc). If low is assigned,<br />
then the pen in an abnormal condition will<br />
track at the low side of the scale. If high is assigned,<br />
then the pen in an abnormal condition will track at<br />
the high side of the scale.<br />
A. Programming Pens Assign- The following<br />
steps and Figure 4-7 guide the user in programming<br />
Pens Assign:<br />
1. Press the Menu Button on the <strong>Display</strong> Button<br />
Bar.<br />
2. Press the PROGram Button on the Command<br />
Button Bar.<br />
3. Use the Up (↑) or Down (↓) Arrow Keys, on the<br />
Button Bar, to scroll to “Chart/Pens” and press the<br />
ENTER Button.<br />
4. Use the Up (↑) or Down (↓) Arrow Keys, on the<br />
Button Bar, to scroll to “Pens” and press the<br />
ENTER Button. The Pens Menu will be displayed.<br />
5. Use the Up (↑) or Down (↓) Arrow Keys, on the<br />
Button Bar, to highlight “Pens assign” and press<br />
the ENTER Button.<br />
6. A pop-up dialog box will display the Pen 1 point<br />
assignment in the text box. Use the Up (↑) or<br />
Down (↓) Arrow Keys in the dialog box to scroll to<br />
the point number you wish to assign to Pen 1 and<br />
press the ENTER button.<br />
7. The text box in the pop-up dialog box will now<br />
display the next pen number and its point assignment.<br />
Program the point assignment just as done<br />
in Step 6 and press ENTER. Continue assigning<br />
points to pens until all six pens have point numbers<br />
assigned to them if desired. After Pen 6 is<br />
programmed and ENTER is pressed, the display<br />
will return to the Pens Menu.<br />
4-17


