SIREC D Display Recorder 7ND4000
SIREC D Display Recorder 7ND4000
SIREC D Display Recorder 7ND4000

Erfolgreiche ePaper selbst erstellen
Machen Sie aus Ihren PDF Publikationen ein blätterbares Flipbook mit unserer einzigartigen Google optimierten e-Paper Software.
Operation<br />
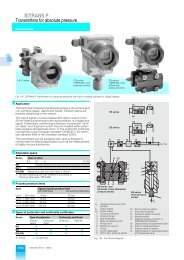
5. Alarms/Events Data Log -The alarm/event<br />
window is used to display alarms, events and reset<br />
information. This data may also be recorded<br />
to disk by enabling Alarm data in the “PROGram<br />
- Disk functions - Alarm on/off” menu. (Chapter<br />
4).<br />
The second line of the display indicates the<br />
status of the alarm checking. If alarm checking is<br />
enabled this will indicate ‘Alarm Check On’ or it<br />
will indicate ‘Alarm Check Off’ in which case no<br />
alarms will occur. The state of alarm checking is<br />
changed in the “FUNCtion - Alarm Check” menu<br />
(Chapter 3).<br />
The format for any entry in the Alarm/Event file is<br />
- Date Time Point Status Value. The Point value<br />
is shown as Pt X, where X is the point number.<br />
The Value shown is dependent on the Event. The<br />
Event can be an Alarm, an input contact closure<br />
(event) or a reset, either automatic or manual.<br />
For linear inputs, the alarm event description is<br />
HIGH1 or LOW2, where the number is the alarm<br />
count up to a maximum of 5. For conditional inputs,<br />
the alarm event descriptions are TRUE or<br />
FALSE. The value is the actual value at the time<br />
the alarm was registered. An event message of<br />
“*” is an alarm return to normal condition, the time<br />
the point came out of alarm.<br />
Resettable points, such as totalizers, will show<br />
the event as RESET, with the actual value at the<br />
time of reset. Some Resettable point types, such<br />
as HI PEAK will have two entries (Pt 6 above).<br />
The first entry is the date and time that the high<br />
peak occurred, with the peak value, the second<br />
entry, above it, is the actual time the reset occurred,<br />
with the value at that time.<br />
3-8<br />
NOTE<br />
Resettable points will not print unless the<br />
Reset Print option is turned on in the<br />
“PROGram - Points” menu (Chapter 4).<br />
For external events via the digital inputs, you can<br />
define separate messages for each of the three<br />
inputs, one for input activated (Close) and one for<br />
input deactivated (Open). These event messages<br />
can be entered, up to a maximum of ten characters,<br />
in the “PROGram - Digital I/O - Event msgs”<br />
menu (Chapter 4). This message will appear in<br />
the log as - date - time - Switch number (Sw X) -<br />
Event message. Default event messages are<br />
CLOSE and OPEN as in the last line in the logger<br />
example above. Figure 3-12 shows a typical<br />
Alarms/Event Data Log.<br />
SOUTHPO LE UNIT #6 REC OFF<br />
1<br />
Alarms/Events Data Log<br />
Alarm Check On<br />
04/22 16:50:31 Pt 3 - HIGH1 1000<br />
0 4 /2 2 1 6 :5 0:3 1 P t 4 - R e se t 8 0 9<br />
0 4 /2 2 1 6 :5 0:3 1 P t 3 - R e se t 0<br />
0 4 /2 2 1 6 :5 0:3 0 P t 2 - R e se t 0<br />
0 4 /2 2 1 6 :5 0:3 0 P t 1 - R e se t 0<br />
0 4 /2 2 1 6 :4 9:5 0 P t 1 - R e se t 0<br />
0 4 /2 2 1 6 :4 9:4 9 P t 1 - R e se t 0<br />
VIEW BROWS 04/16/97 4:59:29 JOG MENU<br />
103709MA<br />
Figure 3-12 Alarms/Events Data Log View<br />
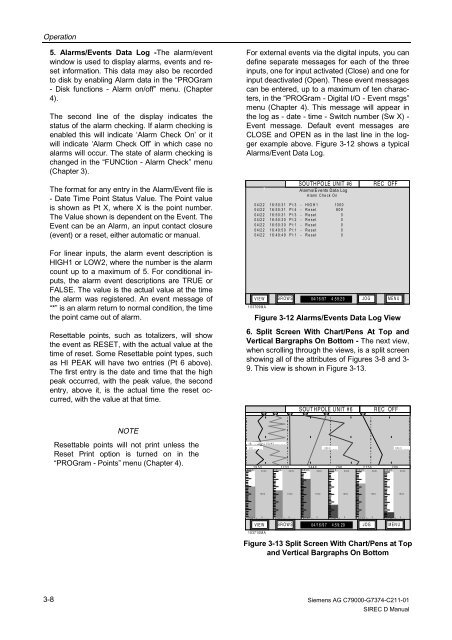
6. Split Screen With Chart/Pens At Top and<br />
Vertical Bargraphs On Bottom - The next view,<br />
when scrolling through the views, is a split screen<br />
showing all of the attributes of Figures 3-8 and 3-<br />
9. This view is shown in Figure 3-13.<br />
1<br />
1B G R=2 P O INT<br />
SOUT HPOLE UNIT #6 REC OFF<br />
2 3 5 4<br />
6<br />
0.0 300.0 600.0<br />
1950 1703 2448 798 2158 299<br />
SECS 3000<br />
SECS 3000<br />
SECS<br />
3000<br />
SECS 3000<br />
SECS<br />
3000<br />
SECS<br />
3000<br />
POIN T 1<br />
1500<br />
0<br />
POINT 2<br />
1500<br />
0<br />
POIN T 3<br />
1500<br />
0<br />
POIN T 4<br />
VIEW<br />
103710MA<br />
BROWS 04/16/9 7 4:5 9:29 JOG MENU<br />
1500<br />
0<br />
POINT 5<br />
Siemens AG C79000-G7374-C211-01<br />
<strong>SIREC</strong> D Manual<br />
1500<br />
0<br />
POINT 6<br />
Figure 3-13 Split Screen With Chart/Pens at Top<br />
and Vertical Bargraphs On Bottom<br />
1500<br />
0