SIREC D Display Recorder 7ND4000
SIREC D Display Recorder 7ND4000
SIREC D Display Recorder 7ND4000

Erfolgreiche ePaper selbst erstellen
Machen Sie aus Ihren PDF Publikationen ein blätterbares Flipbook mit unserer einzigartigen Google optimierten e-Paper Software.
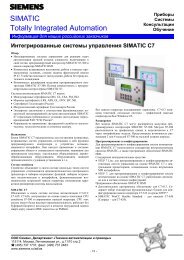
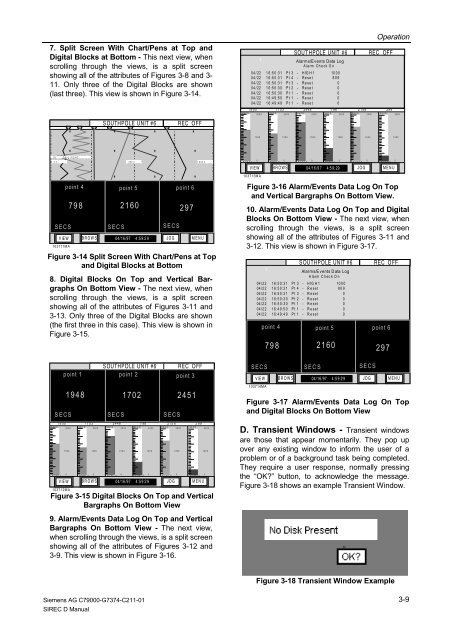
7. Split Screen With Chart/Pens at Top and<br />
Digital Blocks at Bottom - This next view, when<br />
scrolling through the views, is a split screen<br />
showing all of the attributes of Figures 3-8 and 3-<br />
11. Only three of the Digital Blocks are shown<br />
(last three). This view is shown in Figure 3-14.<br />
1<br />
1B G R=2 P O INT<br />
VIEW<br />
103711MA<br />
BROWS 04/16/97 4:59:29 JOG MENU<br />
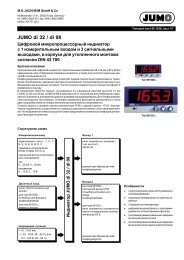
8. Digital Blocks On Top and Vertical Bargraphs<br />
On Bottom View - The next view, when<br />
scrolling through the views, is a split screen<br />
showing all of the attributes of Figures 3-11 and<br />
3-13. Only three of the Digital Blocks are shown<br />
(the first three in this case). This view is shown in<br />
Figure 3-15.<br />
9. Alarm/Events Data Log On Top and Vertical<br />
Bargraphs On Bottom View - The next view,<br />
when scrolling through the views, is a split screen<br />
showing all of the attributes of Figures 3-12 and<br />
3-9. This view is shown in Figure 3-16.<br />
Siemens AG C79000-G7374-C211-01<br />
<strong>SIREC</strong> D Manual<br />
S OUTHPOLE UNIT #6 REC OFF<br />
2 3 5 4<br />
6<br />
0.0 300.0 600.0<br />
point 4 point 5 point 6<br />
798 2160 297<br />
SECS SECS SECS<br />
Figure 3-14 Split Screen With Chart/Pens at Top<br />
and Digital Blocks at Bottom<br />
S OUTHPO LE UNIT #6 REC O FF<br />
point 1 point 2 point 3<br />
1950 1703 2448 798 2158 299<br />
SECS<br />
3000<br />
SE C S<br />
3000<br />
SECS 3000<br />
SE C S<br />
3000<br />
SECS<br />
3000<br />
SECS<br />
3000<br />
POIN T 1<br />
VIEW BROWS 04/16/97 4:59:29 JOG MENU<br />
103712MA<br />
1948 1702 2451<br />
SECS SECS<br />
SECS<br />
1500<br />
0<br />
POINT 2<br />
1500<br />
0<br />
POIN T 3<br />
1500<br />
0<br />
POINT 4<br />
1500<br />
0<br />
POIN T 5<br />
1500<br />
0<br />
POINT 6<br />
Figure 3-15 Digital Blocks On Top and Vertical<br />
Bargraphs On Bottom View<br />
1500<br />
0<br />
1500<br />
0<br />
SOUT HPOLE UNIT #6 REC OFF<br />
Operation<br />
19 50 1703 2448 798 2158 299<br />
SECS 3000<br />
SECS 3000<br />
SECS<br />
3000<br />
SECS 3000<br />
SECS<br />
3000<br />
SECS<br />
3000<br />
POIN T 1<br />
1 Alarms/Events Data Log<br />
Alarm Check On<br />
04/22 16:50:31 Pt 3 - HIGH1 1000<br />
04/22 16:50:31 Pt 4 - Reset 809<br />
04/22 1 6 :5 0:31 P t 3 - Re set 0<br />
04/22 1 6 :5 0:30 P t 2 - Re set 0<br />
04/22 1 6 :5 0:30 P t 1 - Re set 0<br />
04/22 1 6 :4 9:50 P t 1 - Re set 0<br />
04/22 1 6 :4 9:49 P t 1 - Re set 0<br />
POINT 2<br />
1500<br />
0<br />
POIN T 3<br />
1500<br />
VIEW<br />
103713MA<br />
BROWS 04/16/97 4:59:29 JOG MENU<br />
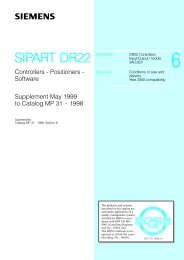
10. Alarm/Events Data Log On Top and Digital<br />
Blocks On Bottom View - The next view, when<br />
scrolling through the views, is a split screen<br />
showing all of the attributes of Figures 3-11 and<br />
3-12. This view is shown in Figure 3-17.<br />
S OUTHPOLE UNIT #6 REC O FF<br />
1 Alarm s/E vents D ata Log<br />
Alarm Check On<br />
04/22 1 6:50 :3 1 P t 3 - H IG H 1 10 00<br />
04 /2 2 1 6 :5 0 :3 1 P t 4 - R e se t 8 0 9<br />
04 /2 2 1 6 :5 0 :3 1 P t 3 - R e se t 0<br />
04 /2 2 1 6 :5 0 :3 0 P t 2 - R e se t 0<br />
04 /2 2 1 6 :5 0 :3 0 P t 1 - R e se t 0<br />
04 /2 2 1 6 :4 9 :5 0 P t 1 - R e se t 0<br />
04 /2 2 1 6 :4 9 :4 9 P t 1 - R e se t 0<br />
0<br />
POIN T 4<br />
point 4 point 5 point 6<br />
798 2160 297<br />
SECS SECS SECS<br />
V IE W<br />
103714MA<br />
B R O W S 04/ 16 /97 4 :5 9:2 9 J O G M E N U<br />
Figure 3-17 Alarm/Events Data Log On Top<br />
and Digital Blocks On Bottom View<br />
D. Transient Windows - Transient windows<br />
are those that appear momentarily. They pop up<br />
over any existing window to inform the user of a<br />
problem or of a background task being completed.<br />
They require a user response, normally pressing<br />
the “OK?” button, to acknowledge the message.<br />
Figure 3-18 shows an example Transient Window.<br />
1500<br />
0<br />
POINT 5<br />
1500<br />
0<br />
POINT 6<br />
Figure 3-16 Alarm/Events Data Log On Top<br />
and Vertical Bargraphs On Bottom View.<br />
Figure 3-18 Transient Window Example<br />
1500<br />
0<br />
3-9