- Page 1 and 2:
32nd ANNUAL CONFERENCE OF THE MILIT
- Page 3 and 4:
32nd Annual Conferenae of the Milit
- Page 5 and 6:
Registration (Continued) RMC M, McK
- Page 7 and 8:
TABLE OF CONTENTS 1990 CONFERENCE C
- Page 9 and 10: 305. 306. 307. 308. 309 * 310. 311.
- Page 11 and 12: 418. Not Presented. 419. HANSON, Ma
- Page 13 and 14: 502. Not Presented. 503. COLLINS, D
- Page 15 and 16: 804A. 804B. ao4c. 804D. 805. DOYLE,
- Page 17 and 18: 'I'li~; CANADIAN RESERVES: CURRENT
- Page 19 and 20: of ‘;llC 1; e f-;
- Page 21 and 22: easons, followed by social reasons
- Page 23 and 24: Training to support these programs
- Page 25 and 26: USAREC commanders in the field take
- Page 27 and 28: lost; but asking for more quality,
- Page 29 and 30: Background ETHNIC PARTKCIPATION IN
- Page 31 and 32: Tahte 1 The Ten Largest Ethnic Grou
- Page 33 and 34: or 25.6% of foreign horns, :Jero ac
- Page 35 and 36: 1990 ARMY CAREER SATISFACTION SURVE
- Page 37 and 38: clashes, etc.). It may be that the
- Page 39 and 40: espondents were so concerned about
- Page 41 and 42: The Use of Artificial Neural Networ
- Page 43 and 44: where: A = (A,, . . . . A,) , B = (
- Page 45 and 46: In attempting to relate ASP score t
- Page 47 and 48: Hispanics in Navy’s Blue-Collar C
- Page 49 and 50: 34.81 33.60 34.00 12.60 12.54 12.28
- Page 51 and 52: Work-g;rouD comoosition. The averag
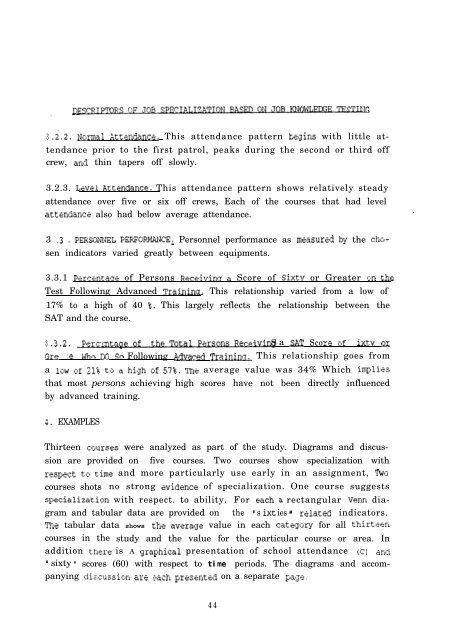
- Page 53 and 54: 1 . INTRODKTICi? DESCRIPTORS OF JOB
- Page 55 and 56: c:- TORc OF JOB SPEr:aON RAm ON JOS
- Page 57 and 58: 2.1.5.4. Pcrcelitage of Persons Rxe
- Page 59: ----- DESCRIPTORS OF JOE SPECIALIZA
- Page 63 and 64: DESCRIPTORS OF JOR SPECIEJ,IZATIaN
- Page 65 and 66: I ? 3 4 5 n 96 96 96 96 67 49 19 II
- Page 67 and 68: ADDRESSING THE ISSUES OF “QUANTIT
- Page 69 and 70: abilities for test development (Stu
- Page 71 and 72: atings for the incumbents given in
- Page 73 and 74: Psycholoqical Bulletin, 70(61, 534-
- Page 75 and 76: quantitative comparison of the sort
- Page 77 and 78: administrative occupations. The lea
- Page 79 and 80: SUMMARY This exploratory study was
- Page 81 and 82: --- These job descriptions were pri
- Page 83 and 84: Table 2 below illustrates the degre
- Page 85 and 86: However, the degree of agreement ob
- Page 87 and 88: Tosunmmrize, informationgeneratedfr
- Page 89 and 90: Change IIf If 1: 1; 0 tl t2 t3 t4 t
- Page 91 and 92: Recammenaations Werecxararrendthat~
- Page 93 and 94: The ORDB was designed and continues
- Page 95 and 96: qualified resources to support cont
- Page 97 and 98: acquisition. ASD/ALH made extensive
- Page 99 and 100: A Suite of Advanced Interpretive As
- Page 101 and 102: CORCAS - The CORCAS report characte
- Page 103 and 104: Discussion The advanced analysis as
- Page 105 and 106: From a technical point of view, the
- Page 107 and 108: y attending schools, to meet the re
- Page 109 and 110: Literature ------. .-- -.~---.. --
- Page 111 and 112:
organizational distribution of the
- Page 113 and 114:
in training cost savings, a reduced
- Page 115 and 116:
APPLICATION OF THE JOB ABILITY ASSE
- Page 117 and 118:
As already shown, rater reliability
- Page 119 and 120:
0 a 103 -t \~~.1~--l---1.1-~L-I I
- Page 121 and 122:
Table 1 Military Assignments in the
- Page 123 and 124:
Preference scores overall sample (N
- Page 125 and 126:
Region School’)North Center South
- Page 127 and 128:
Aptitude-Oriented Manpower Replacem
- Page 129 and 130:
The Psychologist’s Method of Prop
- Page 131 and 132:
Table 5: Study on Job Characteristi
- Page 133 and 134:
equired for an occupation (Ruck, 19
- Page 135 and 136:
For the weapon system design TDS ap
- Page 137 and 138:
knowledge-based model (equation 3)
- Page 139 and 140:
EVALUATION MODEL The evaluation sys
- Page 141 and 142:
and various other sources, we becam
- Page 143 and 144:
.--_-.-- .---- ----- -...- -._--_.-
- Page 145 and 146:
tally significant. Hotelling's T2 w
- Page 147 and 148:
able ancillary information which co
- Page 149 and 150:
and a contractor (Westinghouse) was
- Page 151 and 152:
‘A’ and what knowledge a typica
- Page 153 and 154:
Develop job oriented electricity th
- Page 155 and 156:
year career. Instead, CODAP provide
- Page 157 and 158:
2E 24 20 I@ 12 8 4 Figure 4 Mean Li
- Page 159 and 160:
using event history analysis, which
- Page 161 and 162:
increased student-instructor intera
- Page 163 and 164:
Exercise Performance Group II (inst
- Page 165 and 166:
etween CBT and research on teaching
- Page 167 and 168:
in baseline classes and 39 platoons
- Page 169 and 170:
--. ..____ s platoons. Team Chiefs,
- Page 171 and 172:
._ 50 - BASELINE TRAINING z . WEEK
- Page 173 and 174:
The scenario must be short, concise
- Page 175 and 176:
I PEACiTIME TAIKI I ,......_.,,....
- Page 177 and 178:
have involved complicated procedure
- Page 179 and 180:
I'd like to start with an brief ove
- Page 181 and 182:
~-~___-. -- ---- Brooks et al (1987
- Page 183 and 184:
BATTLE-TASIUBATTLEBOARD TRAINING AP
- Page 185 and 186:
4. Situational Awareness and the Mi
- Page 187 and 188:
examples then chaining the stages s
- Page 189 and 190:
I L THE PERSONNEL APPLIED RESEARCH
- Page 191 and 192:
Typically a commander's awareness o
- Page 193 and 194:
Table 1 Situational Awareness Items
- Page 195 and 196:
answers that precisely indicated th
- Page 197 and 198:
2. Identifying The Problem 2.1. Scr
- Page 199 and 200:
3.1.2. Problem Area: Handling Compl
- Page 201 and 202:
Analyzing User Interactions With In
- Page 203 and 204:
lesson templates. Intelligent lesso
- Page 205 and 206:
iteration of the evaluation study.
- Page 207 and 208:
MILITARY TWTING ASSOCIATION iYH) An
- Page 209 and 210:
DATA INPUT Two methods are provided
- Page 211 and 212:
10 WE 1ASI YlslRUc70n IS PROMPlED 1
- Page 213 and 214:
The linear model indicates that the
- Page 215 and 216:
Cost-Effectiveness of Home Study us
- Page 217 and 218:
- ---.. Eouinment, Procedure and Da
- Page 219 and 220:
Figure 1 shows the total course con
- Page 221 and 222:
(1) Determine criticality of the ob
- Page 223 and 224:
(4) Length of the material tested.
- Page 225 and 226:
(e) Average the total responses and
- Page 227 and 228:
-- ---. ----- --- --.._ _ .I-. I he
- Page 229 and 230:
On the POMS, two-way ANOVAs for rep
- Page 231 and 232:
Journal of Clinical Pharmacology, 2
- Page 233 and 234:
. Stressors An anal.ysis was made o
- Page 235 and 236:
. The Test After a short demonstrat
- Page 237 and 238:
then by the principle of transitivi
- Page 239 and 240:
the order they were obtained. FoLLo
- Page 241 and 242:
a regression equation can be create
- Page 243 and 244:
--__-. -. _ the Army’s near-term
- Page 245 and 246:
however, would be to determine whet
- Page 247 and 248:
Development of a New Language Aptit
- Page 249 and 250:
e preferable to group languages int
- Page 251 and 252:
Implementation of Content Validity
- Page 253 and 254:
Air Force enlisted specialties. The
- Page 255 and 256:
clear reference support and accepta
- Page 257 and 258:
Barbara Jezior U.S. Army Natick Res
- Page 259 and 260:
Figure 2’s scatterplot shows the
- Page 261 and 262:
---.---- ---._. -.. \ ASVAB, Descri
- Page 263 and 264:
tests in a paper-and-pencil mode; t
- Page 265 and 266:
Corps MOSS will include: Motor Tran
- Page 267 and 268:
ASSESSMENT OF APTITUDE REQUIREMENTS
- Page 269 and 270:
I AFI’ITUDE ASSESSMENT TOOLS FOR
- Page 271 and 272:
Currently. most personnel psycholog
- Page 273 and 274:
Sample METHOD The sample consisted
- Page 275 and 276:
Table 1 Correlation Matrix of Predi
- Page 277 and 278:
performance criteria. Classificatio
- Page 279 and 280:
Variables Criteria. Two measures of
- Page 281 and 282:
Psychometric Properties of NOAE! Pr
- Page 283 and 284:
predicts MARS III training success,
- Page 285 and 286:
One-hundred and eighty of the most
- Page 287 and 288:
Table 2 presents the intercorrelati
- Page 289 and 290:
lower) than those of soldiers who r
- Page 291 and 292:
For each administration, the tests
- Page 293 and 294:
Table IV cont. EM-46 13 Paygrade 1
- Page 295 and 296:
Discussion This study failed to sho
- Page 297 and 298:
afterwards. The purpose of the curr
- Page 299 and 300:
consuming the carbohydrate. This st
- Page 301 and 302:
REFERENCES Banderet, L. E., Lieberm
- Page 303 and 304:
Virtually all life experiences are
- Page 305 and 306:
verified can reduce faking (Schrade
- Page 307 and 308:
Glennon, J. R., Albright, L. E., &
- Page 309 and 310:
to develop materials to the best le
- Page 311 and 312:
considerable time preparing for the
- Page 313 and 314:
REFERENCES Laabz., G. ~1.) &‘< Be
- Page 315 and 316:
Similarly, a number of vocational i
- Page 318 and 319:
tool wi th which tu begin acquaint
- Page 320 and 321:
PREDICTING PERFORMANCE WITR BIODATA
- Page 322:
analysis. For biodata items in whic
- Page 325 and 326:
Table 6 presents the results of the
- Page 327 and 328:
surveyed job incumbent is requested
- Page 329 and 330:
overall predictive efficiency, (i.e
- Page 331 and 332:
anged from 62% (908X0) to 89% (112X
- Page 333 and 334:
THE SURVEY INSTRUMENT The SKT Task
- Page 335 and 336:
C. Clusterine of Factor Profiles vs
- Page 337 and 338:
DJSCUSSION unit weighting at the E-
- Page 339 and 340:
The ODCSPER directed that a Physica
- Page 341 and 342:
Factor 1, For purposes of this pape
- Page 343 and 344:
Discussion Certain characteristics
- Page 345 and 346:
Instruments -.~--..-~---.- --... ._
- Page 347 and 348:
Overall, the results replicate the
- Page 349 and 350:
REFERENCES Hanson, M.A., Hallam, G.
- Page 351 and 352:
Sub jects---Twen ty medical researc
- Page 353 and 354:
In the second study, the response r
- Page 355 and 356:
SUBJECTIVE STATES QUESTIONNAIRE: PE
- Page 357 and 358:
each item on the SSQ was read to th
- Page 359 and 360:
I4 BI k3 ; 2 BASELINE WALK 1 FIG. 2
- Page 361 and 362:
Validity of Grade Point Average: Do
- Page 363 and 364:
elationships. The highest correlati
- Page 365 and 366:
College Selectivity Versus Educatio
- Page 367 and 368:
Introduction Flight Psychological S
- Page 369 and 370:
1) Demonstration Phase The control
- Page 371 and 372:
published in the “Wehtpsychologis
- Page 373 and 374:
Introduction Leadership in Aptitude
- Page 375 and 376:
A further objective was to produce
- Page 377 and 378:
his group, to insist on a short che
- Page 379 and 380:
ehavior will be invalid. This condi
- Page 381 and 382:
In the fire fighting system prevent
- Page 383 and 384:
. . . -.-- -.-I to their decision-m
- Page 385 and 386:
In the Federal Armed Forces, this c
- Page 387 and 388:
Evaluation of the counseling nroced
- Page 389 and 390:
TABLE 2. Ranking, Weighting, and Sc
- Page 391 and 392:
. EJectronlcs KnowledQg (Table A-3)
- Page 393 and 394:
3. Further test the TAE approach on
- Page 395 and 396:
* PC.05 * * pc.01. *** pc.001. Corr
- Page 397 and 398:
Table 1 Subjects MOS Enlisted Job N
- Page 399 and 400:
Table 3 Proportion of Criterion Var
- Page 401 and 402:
some ASVAB and Project A predictors
- Page 403 and 404:
the higher-scoring examinees will a
- Page 405 and 406:
Table 2 Correlation Coefficients of
- Page 407 and 408:
-~ . -______ -__--..- REFERENCES La
- Page 409 and 410:
REFERENCES Lawshe, C. H. (1975). A
- Page 411 and 412:
ubjects in each analysis may differ
- Page 413 and 414:
-.- -. -.-- -. The Minnelrota Multi
- Page 415 and 416:
the scales based on character of se
- Page 417 and 418:
school diploma graduates (10,6%, 14
- Page 419 and 420:
criterion.(-.09). Variabk? Table 2
- Page 421 and 422:
Laurence, J. H., & Gribben, M. A. (
- Page 423 and 424:
Subjects were al lowed to use the a
- Page 425 and 426:
-- I
- Page 427 and 428:
-~-- -___- - Subjects Sixteen soldi
- Page 429 and 430:
The effects of both altitude exposu
- Page 431 and 432:
___ .- _- .~- __--_.--~~ .--. --.-
- Page 433 and 434:
factors from both enemy and friendl
- Page 435 and 436:
Using those systems tasks which are
- Page 437 and 438:
'L'KADLNC; OE'k' PEKFOKMANCE, TKAlN
- Page 439 and 440:
PPOPORTI ON OF PEOPLE 04 .T.# - 90
- Page 441 and 442:
which is a check oE logical necessi
- Page 443 and 444:
FINAL REPORT, COMPUTER ASSISTED GUI
- Page 445 and 446:
___-. ----- ..~._ ~. ----~--..---.-
- Page 447 and 448:
As a further measure of the effecti
- Page 449 and 450:
5. Training is essential to the suc
- Page 451 and 452:
Post Selection Board Analysis Post-
- Page 453 and 454:
-- higher. The second approach was
- Page 455 and 456:
Figure 1. Lowest Break in Vertical
- Page 457 and 458:
THE USE OF INCENTIVES IN LIGHT INFA
- Page 459 and 460:
%5 (+ 40- ‘-J 3 o- Lt) 2 o- 1 3-
- Page 461 and 462:
otation, and 6) general job motivat
- Page 463 and 464:
COHESION IN CONTEXT Guy L. Siebold
- Page 465 and 466:
een used in prior research and thus
- Page 467 and 468:
-_._____ __ _.._^.._ _.. _.^ _-- wa
- Page 469 and 470:
EVALUATION OF THE ARMY’S FINANCE
- Page 471 and 472:
The three critical issues were form
- Page 473 and 474:
. operational capability was valida
- Page 475 and 476:
(c) Take-home package observations
- Page 477 and 478:
Figure 1. . INHIBITORS OF INITIATIV
- Page 479 and 480:
STARTING A TQM PROGRAM IN AN R&D OR
- Page 481 and 482:
are used to examine the processes a
- Page 483 and 484:
Management must listen, but also le
- Page 485 and 486:
32nd Conference of the Miiitarv Tes
- Page 487 and 488:
e. Ceployability research On severa
- Page 489 and 490:
--- --- We estimate that 25% of all
- Page 491 and 492:
e. Furthermore, I have been c:omman
- Page 493 and 494:
Acceptance of Change An Empirical T
- Page 495 and 496:
supervisor-subordinate relations, m
- Page 497 and 498:
I_- __-- ____-._ -.- -- -.. .-.----
- Page 499 and 500:
TWEEDDALE, J. W. (Chair), Chief of
- Page 501 and 502:
____ _.... ___----- .._._ - ___.I.-
- Page 503 and 504:
i I I Scholarship: Quality of learn
- Page 505 and 506:
--- -_ ------__ -_-._-_--.-_.--- -_
- Page 507 and 508:
I were dcrivcd lo optimally prcdicl
- Page 509 and 510:
2. While the academically oriented
- Page 511 and 512:
Accordingly, the NROTC selection in
- Page 513 and 514:
the behavioral statements for guidi
- Page 515 and 516:
- .__ the new interview is criterio
- Page 517 and 518:
iors, these items are more likely t
- Page 519 and 520:
Comuarison with “Honest” Sample
- Page 521 and 522:
Conclusions The final experimental
- Page 523 and 524:
THE INVESTIGATIVE INTERVIEW> A REVI
- Page 525 and 526:
7B---.-- -- rapport with the subjec
- Page 527 and 528:
staff concluded that inclusion of t
- Page 529 and 530:
Backaround Each of the military ser
- Page 531 and 532:
Empirical Scorinq Key Prescreening
- Page 533 and 534:
The base rate for applicants who re
- Page 535 and 536:
installations were visited to obtai
- Page 537 and 538:
Obstacles in Maintainina an Effecti
- Page 539 and 540:
Installation security managers also
- Page 541 and 542:
The goal for the CVAL system was to
- Page 543 and 544:
Based on the feedback received from
- Page 545 and 546:
(1) The keynote in interpreting the
- Page 547 and 548:
NAVY ': HANDS-ON AND KNOWLEDGE TEST
- Page 549 and 550:
The general knowledge test consiste
- Page 551 and 552:
I Table 4 Correlations Between Writ
- Page 553 and 554:
1 Interrater Reliability as an Indi
- Page 555 and 556:
might influence task performance. T
- Page 557 and 558:
Figure 2 shows temporal effects at
- Page 559 and 560:
ARMY: JOB PERFORMANCE MEASURES FOR
- Page 561 and 562:
for MOS-specific tasks, as the perc
- Page 563 and 564:
Table 3 shows the intercorrelations
- Page 565 and 566:
The USAF Occupational Measurement S
- Page 567 and 568:
In addition to SKTs and PFEs, USAFO
- Page 569 and 570:
only for the first job, as well as
- Page 571 and 572:
The Examirler is a sopilisticated c
- Page 573 and 574:
The Examiner Multiple Choice Multip
- Page 575 and 576:
Paner and Pencil Testing The Examin
- Page 577 and 578:
The Exanliwr is ii sopllis[ic;l(etj
- Page 579 and 580:
(c) The Coast Guard will host the 1
- Page 581 and 582:
ORGANIZATION ROYAL WSTRALIAR AIR FO
- Page 583 and 584:
ORGANIZATION 1990 REPRESENTATIVE RO
- Page 585 and 586:
ORGANIZATION NAVAL HILITARY PERSONN
- Page 587 and 588:
C. Non-Member Participants. 1. Non-
- Page 589 and 590:
committee members shall serve in th
- Page 591 and 592:
CDR Mary Adams Naval Education and
- Page 593 and 594:
Jack R. Dempsey Human Resources Res
- Page 595 and 596:
c _.. -. _ ..-___ Mr. G. J. (Jeff)
- Page 597 and 598:
Deborah L. McCormick Chief,of Naval
- Page 599 and 600:
COL Terry J. Procluk Director of Pe
- Page 601 and 602:
Paul P. Stanley.11 USAFOMC/OMD Rand
- Page 603 and 604:
Abrahams, N. M., 486 Albert, W, G.,


